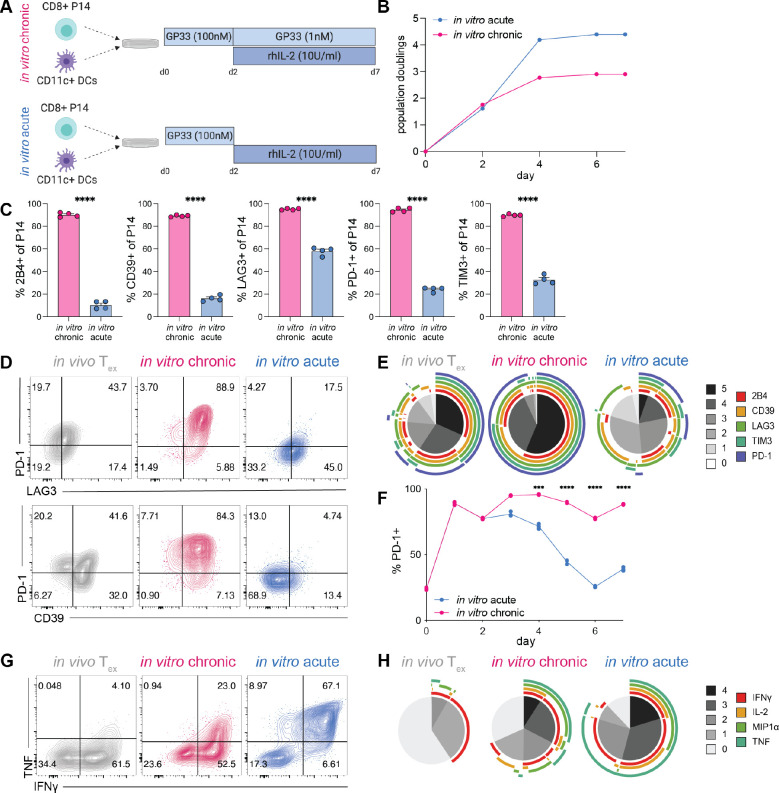
Fig. 1. Chronic antigenic stimulation in vitro induces key features of Tex.
(A) Experiment schematic of chronic and acute stimulation of P14 cells in vitro. (B) Cell expansion during chronic and acute stimulation in vitro. (C) Percent expression of IRs by chronically and acutely stimulated P14 cells (gated on CD44hi CD8+ live singlets); two technical replicates of two biological replicates shown. Significance calculated by unpaired two-tailed t test; ****p<0.0001. (D) Representative flow cytometry data and (E) SPICE analysis of IR co-expression by in vivo Tex (LCMV-Cl13 30dpi), in vitro chronically stimulated P14 cells, and in vitro acutely stimulated P14 cells (gated on CD44hi CD8+ live singlets). (F) Longitudinal PD-1 expression on in vitro chronically and acutely stimulated P14 cells. Representative of 2 experiments; significance calculated by paired two-tailed t test; *p<0.05, **p<0.01, ***p<0.001, ****p<0.0001. (G) Representative flow cytometry data and (H) SPICE analysis of co-production of effector cytokines in in vivo Tex (LCMV-Cl13 30dpi), in vitro chronically stimulated P14 cells, and in vitro acutely stimulated P14 cells. (B-E, G-H) Representative of >3 experiments. (D,G) Numbers in flow cytometry plots indicate percentage of parent population within each gate. (E,H) Grayscale sections in SPICE plots indicate number of IRs/cytokines co-expressed; colored bands indicate individual IRs/cytokines.

