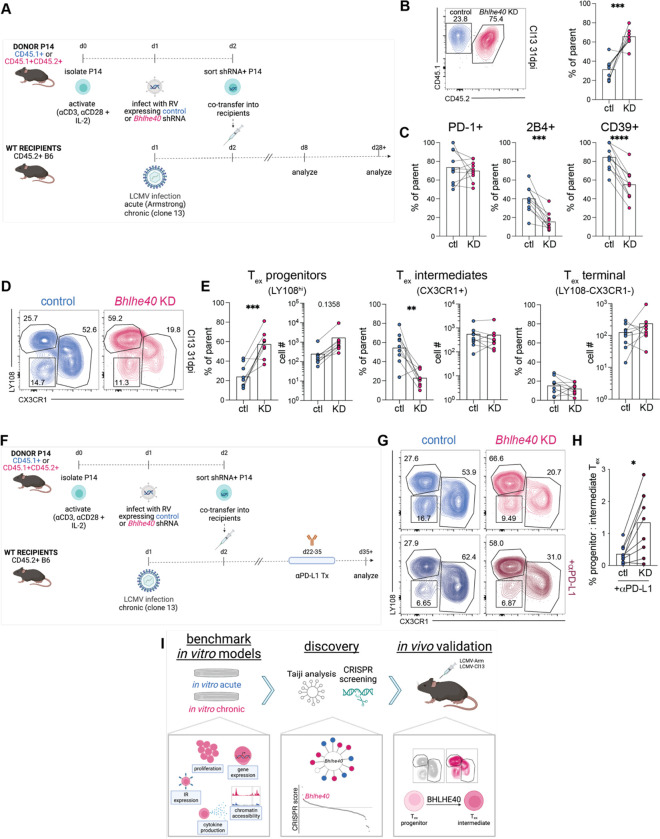
Fig. 5. BHLHE40 is a transcriptional regulator of Tex differentiation.
(A) Experiment schematic of adoptive co-transfer of control and Bhlhe40 knockdown (KD) P14 cells into LCMV Arm- or Cl13-infected recipient mice. (B) [left] Concatenated (n=10) flow cytometry plot and [right] summary data of frequency of control and Bhlhe40 KD P14 cells (gated on GFP+ CD44hi CD8+ live singlets) at 31dpi of LCMV-Cl13. (C) Percent expression of IRs in control and Bhlhe40 KD P14 cells at 31dpi of LCMV-Cl13. (D) Concatenated (n=10) flow cytometry plots of frequency of Tex subsets in control and Bhlhe40 KD P14 cells at 31dpi of LCMV-Cl13. (E) Frequency and total number of progenitor, intermediate, and terminal Tex in control and Bhlhe40 KD P14 cells at 31dpi of LCMV-Cl13. (F) Experiment schematic of adoptive co-transfer of control and Bhlhe40 KD P14 cells into LCMV Cl13-infected recipient mice, with αPD-L1 treatment or vehicle control between 22–35dpi. (G) Concatenated (n=10) flow cytometry plots of frequency of Tex subsets in control and Bhlhe40 KD P14 cells at 37dpi of LCMV-Cl13, after treatment with vehicle control [top] or αPD-L1 [bottom] from 22–35dpi. (H) Ratio of progenitor to intermediate Tex in control and Bhlhe40 KD P14 cells after αPD-L1 treatment. (I) Schematic detailing discovery pipeline. (B-G) n=10 mice, representative of 3 experiments. Significance calculated by paired two-tailed t test; *p<0.05, **p<0.01, ***p<0.001, ****p<0.0001. (B,D,G) Numbers in flow cytometry plots indicate percentage of parent population within each gate.

