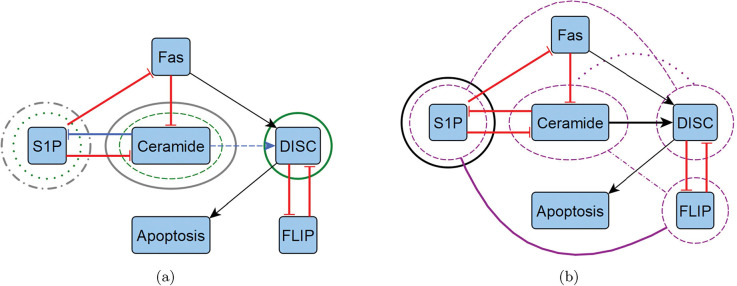
Figure 2:
Reduced T-LGL network target overlaps. We highlight the overlapping control targets from Table 3 by overlaying them with the reduced T-LGL wiring diagram from Figure 1, shown in two diagrams to avoid excessive noise. (a) We show instances of CA edge (blue), CA node (green), and SM (grey). (b) We show instances of CK (black) and FVS (purple). Note that FVS has combinatorial controls with connecting arches, where others are strictly singleton.

