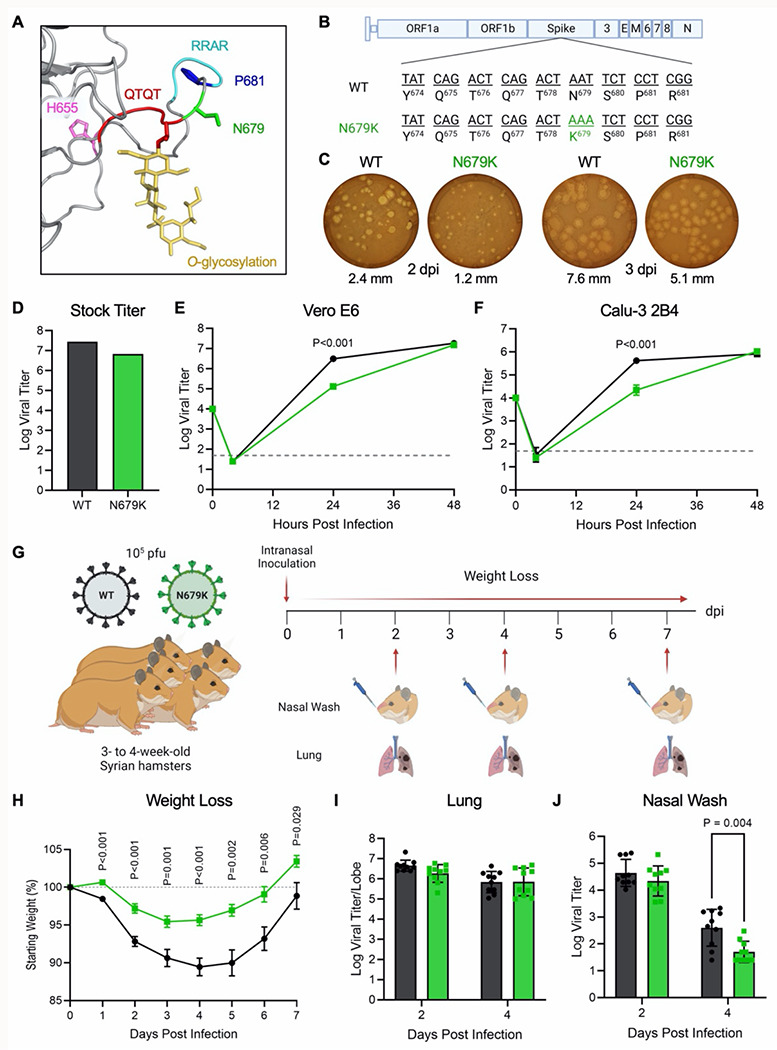
Figure 2. N679K attenuates SARS-CoV-2 replication and disease when isolated.

(A) Structural modeling of O-linked glycosylation of threonine 678 (yellow) of QTQTN motif (red) and the residues mutated in Omicron – H655 (magenta), N679 (green), and P681 (blue) – with N679 adjacent to the glycosylation. The furin cleavage site RRAR is also shown (cyan). (B) Schematic of WT and N679k sArS-CoV-2 genomes. (C) WT and N679K SARS-CoV-2 plaques on Vero E6 cells at 2 dpi (left) and 3 dpi (right). Average plaque size noted below. (D) Viral titer from WT and N679K virus stock with the highest yield generated form TMPRSS2-expressing Vero E6 cells. (E-F) Growth kinetics of WT and N679K in Vero E6 (E) and Calu-3 2B4 (F) cells. Cells were infected at an MOI of 0.01 (n=3). Data are mean ± s.d. Statistical analysis measured by two-tailed Student’s t-test. (G) Schematic of experiment design for golden Syrian hamster infection with WT (black) or N679K (green) SARS-CoV-2. Three- to four-week-old make hamsters were infected with 105 pfu and monitored for weight loss over 7 days. At 2, 4, and 7 dpi, nasal wash and lung was collected for viral titer, and lung was collected for histopathology. (H) Weight loss of hamsters infected with WT (black) or N679K (green) SARS-CoV-2 over 7 days. Data are mean ± s.e.m. Statistical analysis measured by two-tailed Student’s t-test. (I-J) Viral titer of lung (I) and nasal wash (J) collected at 2 and 4 dpi from hamsters infected with WT (black) or N679K (green) SARS-CoV-2. Data are mean ± s.d. Statistical analysis measured by two-tailed Student’s t-test.
