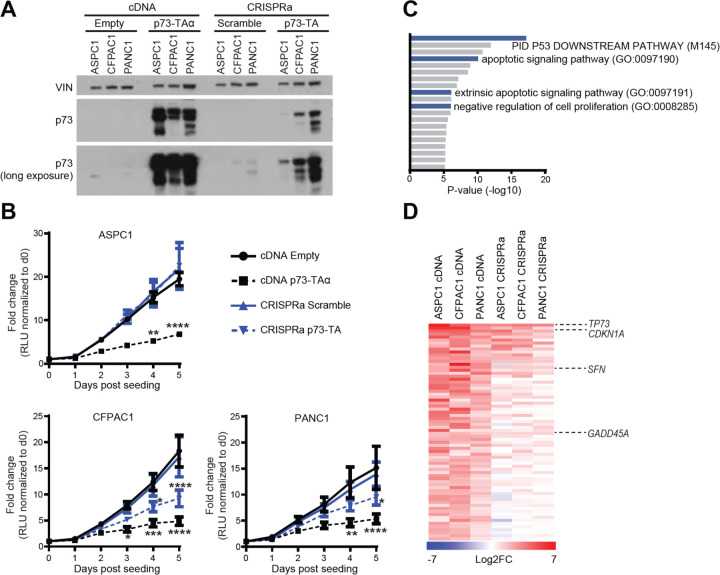
Figure 2. p73-TA elicits p53-like responses in a dose-dependent manner.
(A) Western blot analysis of p73 following lentiviral delivery of TP73-TAα cDNA or CRISPRa-based induction of p73-TA in ASPC1, CFPAC1, and PANC1 cell lines, compared to the empty vector (Empty) or scramble sgRNA (Scramble) controls, respectively. VINCULIN (VIN) shown as a loading control. (B) Proliferation of cell lines mentioned in (A) measured by CellTiterGlo Luminescent Cell Viability Assay; luminescence is measured in relative light units (RLU). For each sample, every data point is normalized to the RLU value on day 0 and represented as fold-change. P-values compared to cDNA Empty sample calculated by two-way ANOVA with Sidak’s multiple comparisons test. *, P ≤ 0.05; **, P ≤ 0.01; ***, P ≤ 0.001; ****, P ≤ 0.0001. Mean ± SEM shown (n=3). (C-D) RNA-seq analysis of cell lines mentioned in (A). (C) Gene ontology (GO) analysis using Metascape (Zhou et al., 2019), interrogating significantly upregulated genes following overexpression of p73-TAα using cDNA. Terms are ranked by their p-values; TP53 and anti-proliferative/apoptotic terms are highlighted in blue. (D) Comparison between cDNA and CRISPRa induced samples of 72 genes that were categorized to the gene ontology terms highlighted in (C). Heatmap shows log2 fold-change in the expression levels of genes when p73-TA is overexpressed compared to the controls. TP73 and example TP53 target genes are labeled (Zhan et al., 1998; Hermeking et al., 1997; El-Deiry et al., 1993). See also Materials and Methods and Supplementary Table 2.

