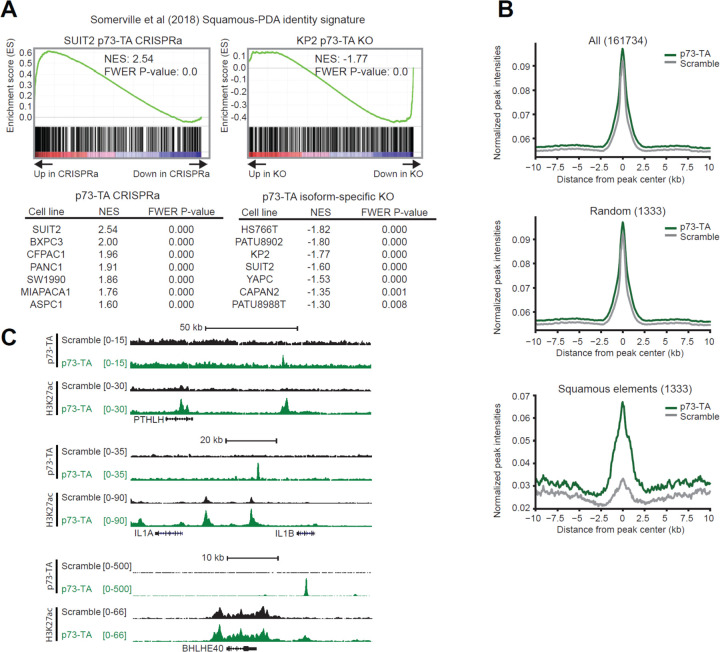
Figure 3. p73-TA promotes squamous transcriptional program in PDAC.
(A) RNA-seq analysis following activation or ablation of p73-TA in PDAC cell lines. Representative plots and tables summarizing GSEA analysis of the squamous subtype PDAC signature (Somerville et al., 2018) following p73-TA activation (left) or knock-out (right) in a panel of PDAC cell lines. (B and C) ChIP-seq analysis following p73-TA activation in SUIT2 cell line. (B) Metagene plots of H3K27ac signals in all elements (top), random elements (middle), and the squamous elements (bottom) (Somerville et al., 2018). (C) ChIP-seq profiles of H3K27ac and p73-TA signals at example genes associated with squamous lineage PDAC and disease aggression (Biffi et al., 2019; Hamdan & Johnsen, 2018; Pitarresi et al., 2021; Somerville et al., 2018; Somerville, Biffi, et al., 2020).

