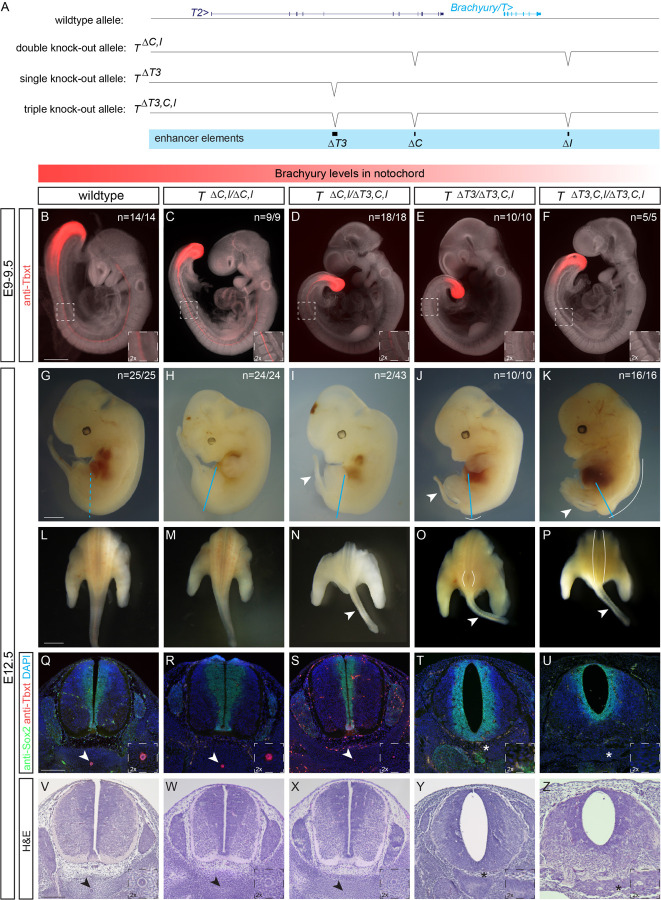
Figure 5: Deletion of the three enhancer elements T3, C and I results in selective loss of Brachyury protein expression in the notochord at E9.5 and posterior defects at E12.5.
(A) Overview of wildtype mouse Brachyury/T/TBXTB locus adapted from the UCSC genome browser and deletion alleles generated with CRISPR-Cas9 genome editing. Exact coordinates and sequences of target sites, deletions, and genotyping primer sequences can be found in Supplemental Table 5.
(B-F) Brachyury/T antibody staining (red) of E9.5 embryos. White dashed square in panels represents location of right bottom inserts with 2x magnification. Brachyury/T protein expression in the notochord is dose-dependent on the three enhancer elements. Scale bar in B: 1 mm, applies to panels B-F.
(G-K) Overall morphology of E12.5 embryos with different genotypes. Blue lines indicate location of immunofluorescence and H&E sections. Spina bifida and tail defects are dose-dependent. Arrowheads marks small tails. White lines mark spina bifida. Scale bar in G: 1 mm, applies to panels G-K.
(L-P) Dorsal view of embryos (sectioned at blue line in G-K). White lines mark areas of spina bifida. Arrowheads mark small tails compared to tails in wildtype control and double knock-out allele. Scale bar in L: 2.5 mm, applies to panels L-P.
(Q-U) Immunofluorescence of mouse transverse sections. Anti-Sox2 labels the neural plate, anti-Tbxt the notochord, and DAPI marks nuclei. Sox2 expression is comparable amongst all genotypes, even in the genotypes with spina bifida, while there is loss of Brachyury/T staining in the notochord with increased loss of the enhancers. Arrowheads point to notochord. Asterisks mark absent notochord. Scale bar in Q: 0.2 mm, applies to panels Q-U.
(V-Z) H&E staining of transverse sections confirm the dose-dependent loss of the notochord and spina bifida. Arrowheads point to notochord. Asterisks mark absent notochord. Scale bar in V: 0.2 mm, applies to panels V-Z.

