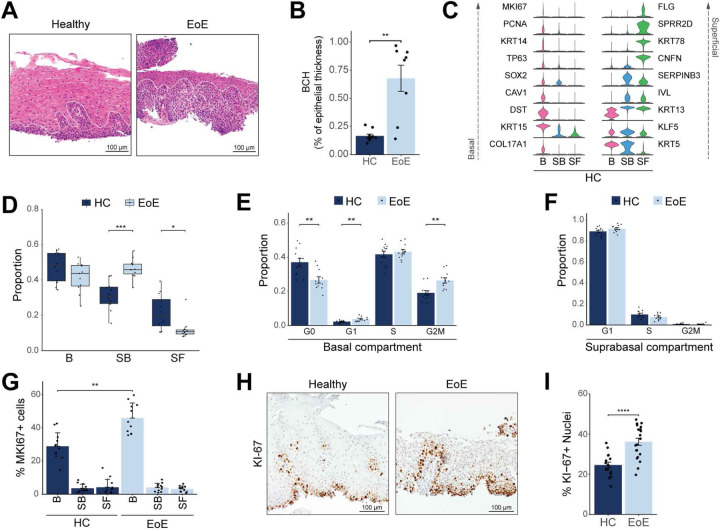
Figure 3. Determination of proliferation levels in different esophageal epithelial compartments in EoE.
(A) H&E staining of HC (n = 10) and EoE (n = 8) esophageal mucosal sections from patients in the scRNA-seq cohort. The basal compartment in HC or BCH as defined by pathologists in EoE is outlined by the white dashed line. Scale bar, 100 μm. (B) Box plot showing the height of the epithelium occupied by the basal zone as a function of total thickness in H&E-stained sections from (A). (C) Violin plots displaying the expression of established marker genes for each EEC compartment in HC. (D) Box plot showing the proportion of each EEC compartment as a fraction of all epithelial cells for each disease condition. Boxes represent quartiles, whiskers indicate minima/maxima, and lines through each box denote median proportion. (E-F) Bar plots demonstrating the proportion of cells in each cell cycle phase in either the basal (E) or suprabasal (F) compartment. (G) Bar plot showing the percent of cells expressing MK/67 in each EEC compartment in EoE and HC. (H) Representative immunohistochemistry for KI-67 in the esophageal epithelium of HC (n = 16) and EoE (n = 21). Scale bar, 100 μm. (I) Quantification of KI-67+ cells from immunohistochemistry in HC and EoE. All indicated P values were determined using Wilcoxon signed-ranked test, with Benjamini & Hochberg adjustment for multiple comparisons specifically applied in (D-G). *P ≤ 0.05, **P ≤ 0.01, ***P ≤ 0.001, ****P ≤ 0.0001. Basal (B), Suprabasal (SB), Superficial (SF).

