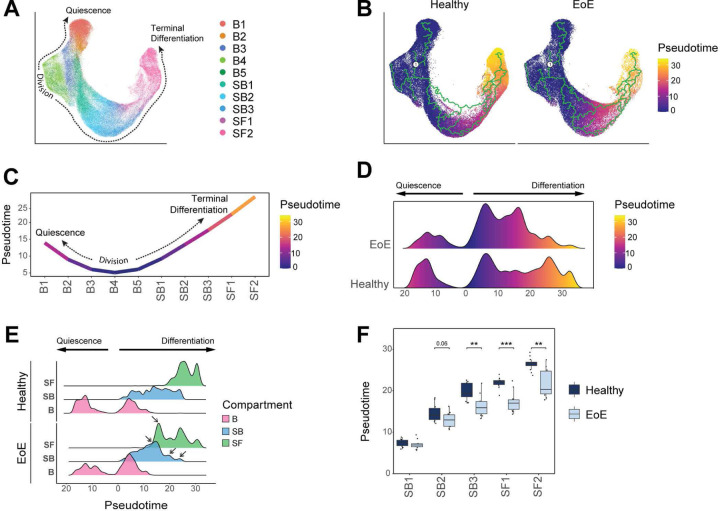
Figure 7. Pseudotemporal trajectory analysis of EEC demonstrates loss of terminal differentiation and global differentiation shift towards basal identity.
(A) UMAP showing merged scRNA-seq datasets of EEC from EoE and HC, colored by integrated clusters. (B) Pseudotime trajectory analysis calculated using EoE and HC samples plotted on UMAP from (A), with S-phase cluster B3 as pseudotime origin. (C) Average pseudotime values across epithelial clusters. (D) Ridgeline plot illustrating the pseudotime value distribution between EEC in EoE and HC. Pseudotime begins at cells in S-phase and increases moving toward either quiescence or terminal differentiation. (E) Ridgeline plots depicting pseudotime value distribution between epithelial compartments in HC and EoE. Arrows indicate peaks with differential density between EoE and HC. (F) Box plot showing the distribution of pseudotime values per differentiated epithelial cluster in EoE or HC. Boxes indicate quartiles, whiskers indicate minima/maxima separated by 1.5 times the interquartile range, lines through each box indicate median pseudotime value. Indicated P values were determined using Wilcoxon signed-ranked test with Benjamini & Hochberg adjustment for multiple comparisons. **P ≤ 0.01, ***P ≤ 0.001. Basal (B), Suprabasal (SB), Superficial (SF).

