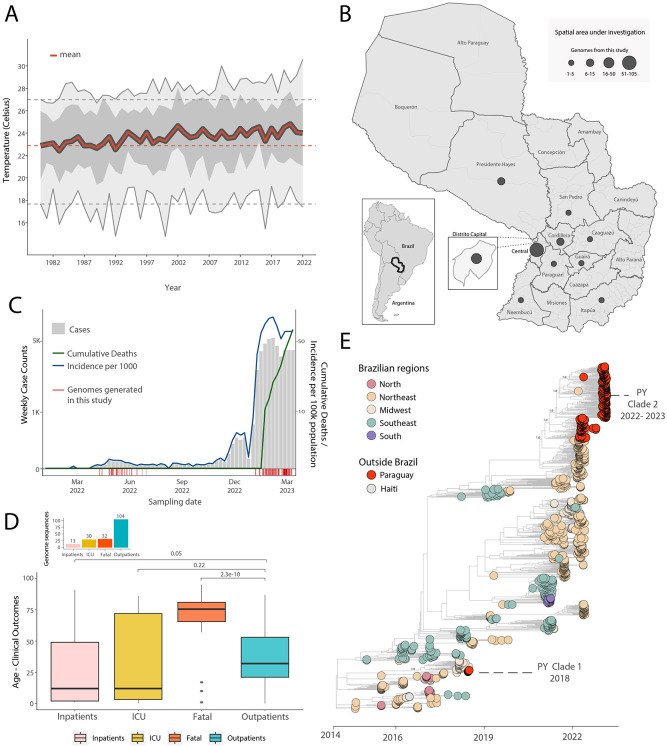
Figure 1. Spatial and temporal distribution of CHIKV cases in Paraguay.
A) Temperature trends in Paraguay between 1981 and 2022. The yearly mean (red full line), yearly minimum and maximum (grey full lines), yearly 50% quantiles (dark grey area) and min, max and mean temperature in 1981 (dashed grey and red lines, respectively) are shown; B) Map of Paraguay showing the number of CHIKV genome sequences by departments. The size of the circles indicates the number of new genomes generated in this study; C) Weekly notified chikungunya cases (grey), incidence normalized per 100 K individuals (blue) and cumulative deaths (green) in 2022-2023 (until EW11), red bars at the bottom highlight the dates of sample collection of the genomes generated in this study; D) Boxplot of the patient’s (representing the study population) age and clinical outcomes value distribution. The Kruskal-Wallis non-parametric approach was used to determine the strength of association within the different clinical outcomes. E) Time-resolved maximum likelihood tree including the newly complete genome sequence from Paraguay (n=179) generated in this study combined with publicly available sequences (n=715) from GenBank collected up to March 30, 2023. Colors indicate geographic location of sampling. Support for branching structure is shown by bootstrap values at key nodes.

