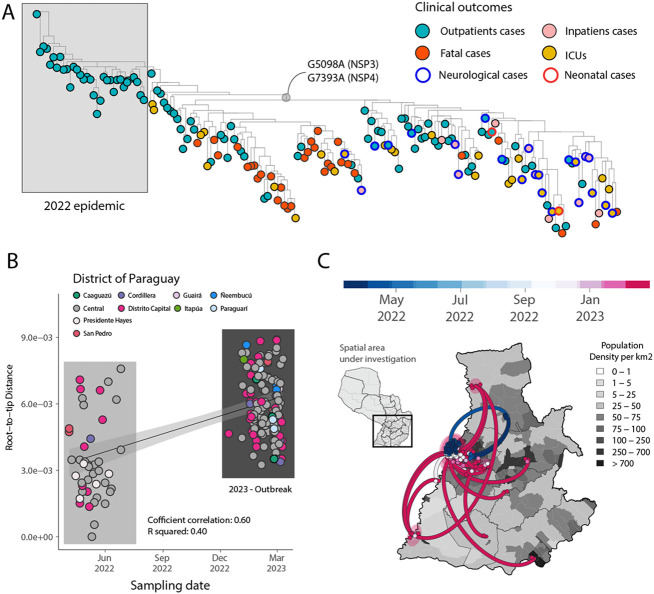
Figure 2. Expansion of the CHIKV-ECSA epidemic in Paraguay.
A) Maximum Likelihood (ML) phylogeny constructed using n=174 CHIKV genome sequences from the PY clade 2 associated with the 2022-2023 epidemic. The tips were colored based on the clinical outcomes. Neurological and neonatal cases have been highlighted in the tree using blue and red borders, respectively. The length of a branch indicates the amount of sequence evolution; B) Regression of root-to-tip genetic distances and sampling dates estimated using TempEst v.1.5.3, buffers (shaded area) representing 90% confidence intervals. Colors indicate geographic location of sampling; C) Spatiotemporal reconstruction of the spread of CHIKV-ECSA in Paraguay. Circles represent nodes of the maximum clade credibility phylogeny, colored according to their inferred time of occurrence (scale shown). Shaded areas represent the 80% highest posterior density interval and depict the uncertainty of the phylogeographic estimates for each node. Solid curved lines denote the links between nodes and the directionality of movement. Differences in population density are shown on a grey-white scale.

