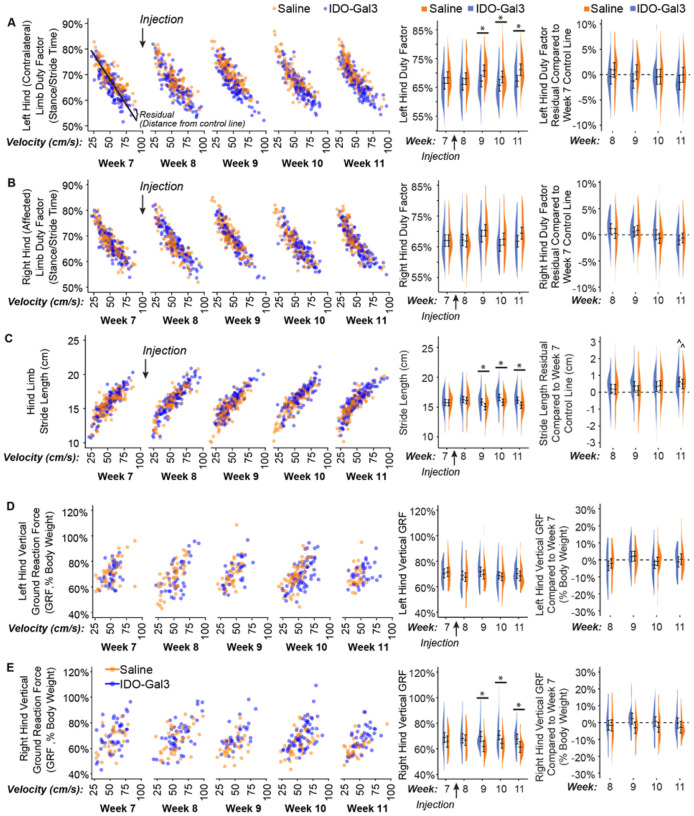
Figure 4. Gait measurements before and after intra-articular injection of IDO-Gal3 or saline in MCLT+MMT operated knees.
Many gait parameters correlate to velocity. As such, velocity-dependent gait parameters are first shown relative to velocity (left column), with each data point shown. Then, shifts in gait parameters were analyzed both as averages and velocity-corrected residuals (using week 7 data as the control line). This allowed for the evaluation of gait shifts related to velocity changes (middle column) and independent of velocity changes (right column). In conjunction with velocity changes, differences between IDO-Gal3 and saline treated rats were found for average left contralateral limb percent stance time (p=0.04, treatment main effect), right operated limb percent stance time (p=0.005, week-treatment interaction), stride length (p=0.02, week-treatment interaction), and right operated limb peak vertical force (p=0.03, treatment main effect). Specifically, differences between IDO-Gal3 and saline treated rats were found for average left limb percent stance time at weeks 9, 10, and 11 (p≤0.048), average stride length at weeks 9, 10, and 11 (p≤0.046), and average right limb peak vertical force at weeks 9, 10, and 11 (p≤0.033). Despite a significant interaction, differences at specific weeks were not detected for average right limb percent stance time. Residualizing data to week 7 control lines eliminated these statistical differences, indicating differences in the gait patterns of IDO-Gal3 and saline treated rats were primarily related to increased walking speed. At week 11, stride lengths were longer in both IDO-Gal3 and saline treated rats relative to the week 7 control line (^, p<0.05); this is typical for experiments lasting longer than a month, as rats continue to have significant skeletal growth into adulthood. Again, data are plotted using density plots, with bars indicating the 95% confidence interval of each treatment-timepoint mean as predicted by our linear mixed effects statistical model.

