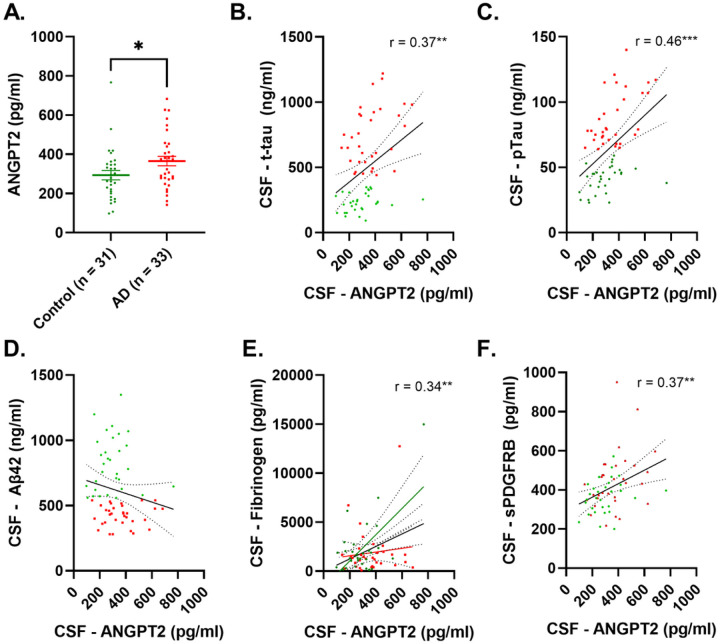
Figure 1.
CSF level of ANGPT2 is elevated in AD in relation to CSF-tau and markers of BBB breakdown in Alzheimer’s disease. A. Dot blot showing significantly higher levels of ANGPT2 in Alzheimer’s disease (AD). B-D Scatterplot showing a positive correlation between ANGPT2 and t-tau and p-tau; no correlation was observed for Aβ42. E-F Scatterplots showing a positive correlation between CSF ANGPT2 level and CSF markers of BBB (fibrinogen and sPDGFRβ). In A, the bars represent the mean ± SEM. In B-F, the best-fit linear regression line is shown and 95% confidence intervals are superimposed. Each dot represents an individual sample. p < 0.05 was considered statistically significant

