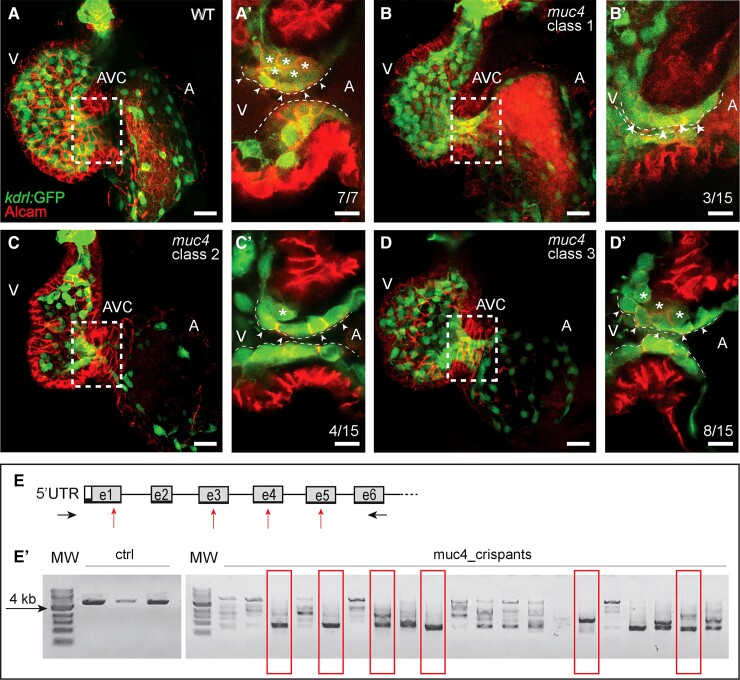
Figure 2.
Zebrafish muc4 knockout using CRISPR/Cas9. (A–D) Maximum intensity projections from confocal z-stack images of hearts at 58 hpf. (A’–D’) Single confocal z-section images of the AVC region. Endocardial cells in luminal positions (arrowheads) at the AVC are marked by kdrl:GFP and Alcam.45 Endocardial cells that have already invaded the extracellular matrix and are in abluminal positions are marked with asterisks. (A’) While in WT control embryos many endocardial cells are in abluminal positions, some of the 15 muc4 crispants with a complete truncation of the genomic locus exhibit a delayed ingression of endocardial cells into the cardiac jelly. The severity of the phenotypes varied according to the following classes: (B’) Class 1 embryos (3 of 15) lack an endocardial cell ingression by that stage; (C’) Class 2 embryos (4 of 15), have only a single endocardial cell ingressing into the cardiac jelly at that stage; (D’) in muc4 crispants of class 3 (8 of 15), a few endocardial cells have ingressed into the cardiac jelly. V, ventricle; A, atrium; AVC, atrioventricular canal. Scale bars are 20 µm (A–D) and 10 µm (A’–D’). (E) Schematic representation of the zebrafish muc4 locus and gRNA binding sites (red arrows). Black arrows indicate the positions of primers used to assess the efficacy of CRISPS-induced knockout by PCR. (E’) Single embryo PCR products from control embryos (ctrl) and embryos injected with a mixture of four gRNAs and Cas9 protein (muc4_crispants). Red boxes are indicating samples that lack any WT genomic amplification bands. Among 58 injected embryos that were genotyped, 15 had a large truncation of the genomic region and did not contain any WT band. Only these crispants were used for phenotypic characterization. MW, molecular weight.

