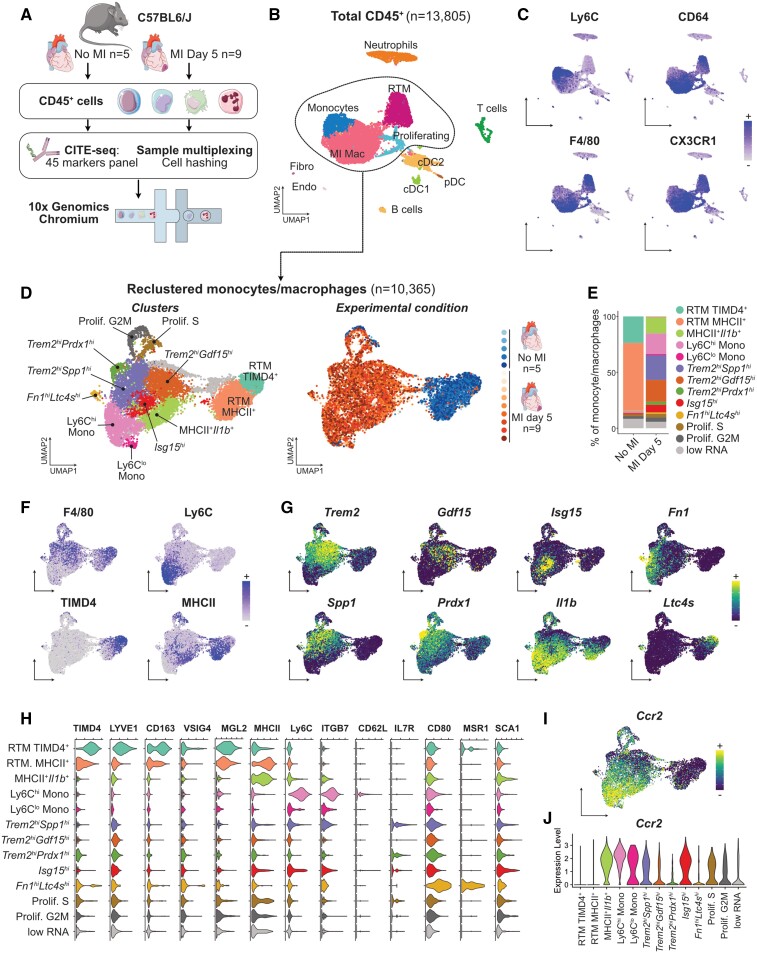
Figure 1.
CITE-seq analysis of the monocyte/macrophage landscape in the steady-state and infarcted heart. For all graphs in this figure, cells were obtained from n = 5 mice without MI, and n = 9 mice with MI, pooled from two independent experiments (see Section 2). (A) Experimental design summary; (B) UMAP representation of transcriptome-based clustering of n = 13 805 total cardiac CD45+ cells; (C) CITE-seq signal for the indicated monocyte/macrophage surface markers projected onto the total CD45+ cells UMAP plot; (D) n = 10 365 cells corresponding to monocytes and macrophages (including proliferating macrophages) were extracted for clustering and UMAP dimensional reduction analysis with annotated cell clusters (left) and sample of origin colour coded on the UMAP plot (right); (E) average proportions of each cluster according to experimental condition; (F) surface markers and (G) transcript expression projected onto the UMAP plot for selected markers used to identify and annotate clusters; (H) expression of the indicated surface markers in each monocyte/macrophage cluster; (I and J) expression of Ccr2 projected on the UMAP plot of monocyte/macrophages (I) and shown across clusters (J). RTM, resident tissue macrophages; MI Mac, MI-associated macrophages; (p)DC, (plasmacytoid) dendritic cell; Endo, endothelial cells; Fibro, fibroblasts.

