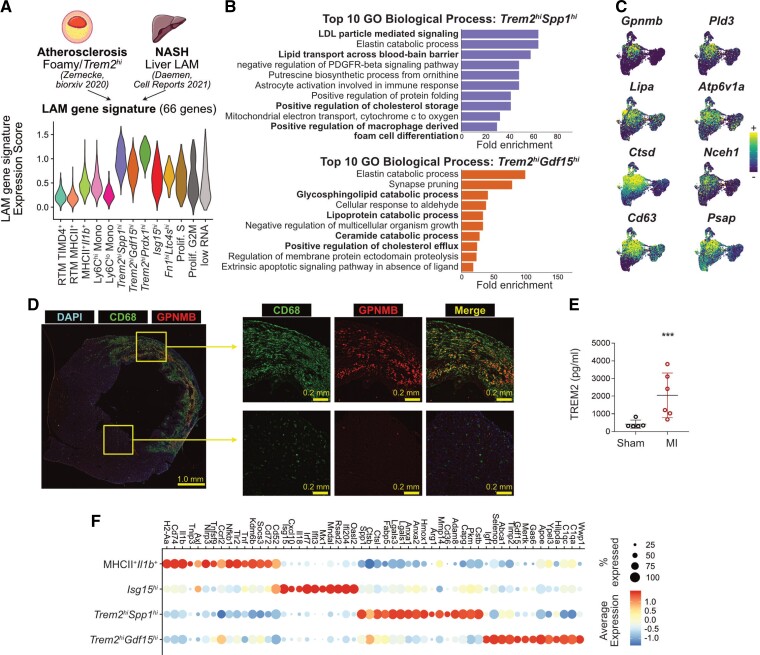
Figure 2.
Identification of Trem2hi macrophages with a LAM signature in the ischaemic myocardium. (A) Sixty-six LAM-signature genes were extracted from the indicated data sets and a gene expression score was applied to cardiac macrophages (LAM-signature expression score), represented here as a violin plot. The atherosclerosis data set consists of a pool of n = 12 scRNA-seq data sets (see Zernecke et al.18); the NASH data set of one scRNA-seq library (Daemen et al.20); the LAM-signature expression score was applied to cardiac macrophages (n = 10 365 cells; cells were obtained from n = 5 mice without MI, and n = 9 mice with MI, pooled from two independent experiments, see Figure 1, see Section 2). (B) Fold enrichment for the top 10 enriched Gene Ontology (GO) Biological Processes in the indicated cardiac macrophage cluster (all with adjusted P-value <0.05); macrophage clusters were determined in analysis shown in Figure 1D from n = 10 365 cells; cells were obtained from n = 5 mice without MI, and n = 9 mice with MI, pooled from two independent experiments. (C) Expression of selected LAM-signature transcripts projected on the UMAP plot of monocytes/macrophages as detailed in Figure 1D (n = 10 365 cells; cells were obtained from n = 5 mice without MI, and n = 9 mice with MI, pooled from two independent experiments). (D) Immunofluorescence labelling of CD68 and GPNMB in Day 5 infarcts with overview of a full myocardial section and high magnification images of the infarcted area and remote non-ischaemic myocardium (representative pictures shown for n = 1 heart). (E) Total levels of TREM2 detected by ELISA in extracts from the hearts of mice after sham operation (n = 5 mice) or permanent MI (Day 5; n = 6 mice). (F) Dot plot showing expression of the selected transcripts in the indicated cardiac macrophage clusters (all the transcripts shown significantly enriched in the relevant clusters with adjusted P-value <0.05); macrophage clusters were determined in analysis shown in Figure 1D from n = 10 365 cells; cells were obtained from n = 5 mice without MI, and n = 9 mice with MI, pooled from two independent experiments. NASH, non-alcoholic steatohepatitis.

