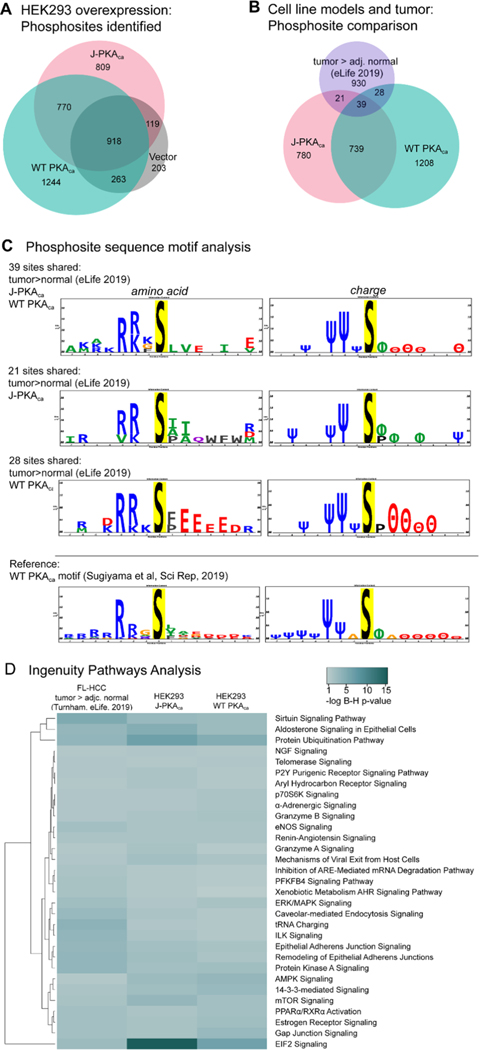
Figure 2.
Characteristics of phosphoprotein signaling and sites. (A) Venn diagram representing phosphosites confidently observed from PKAca- , J-PKAca-, and vector-only expressing cells (created using BioVenn https://www.biovenn.nl/). (B) Phosphosites observed (same lists used as input for IPA) were compared between the HEK293 overexpression models and FL-HCC tumor tissues (tumor > adj. normal, eLife, 201911). Venn diagrams for comparisons of individual sites and for protein identifiers were created with BioVenn. (C) Sequence motif analysis for the overlapping phosphosite observations was performed using PTM-Logo,23 also including motif analysis for the sites observed as phosphorylated by WT PKAca in a previously reported study by Sugiyama et al. in 2019, performing whole-protein in vitro phosphorylation.25 Only significantly over-represented amino acids and charge characteristics at positions −7 to +7 are shown in sequence logos. Charge logo legend: Ψ = basic residue, e.g., K/R; θ = acidic residue, e.g., D/E; ϕ = hydrophobic residue; P = proline; Δ = other. (D) Heatmap generated with https://heatmapper.ca, illustrating selected pathway activation enrichment scores from IPA (Supporting Table S3), comparing phosphorylation sites observed as higher in tumor vs normal FL-HCC tissue in the Turnham et al. study vs HEK293 cells overexpressing J-PKAca or WT PKAca (after filtering each to remove sites observed in vector-only control). Multiple comparison-corrected Benjamini–Hochberg p-values were determined in IPA, with the significance cutoff set at p = 0.05, and only pathways with significant B–H p-value enrichment scores from the Turnham data and the J-PKAca data were included in the heatmap.

