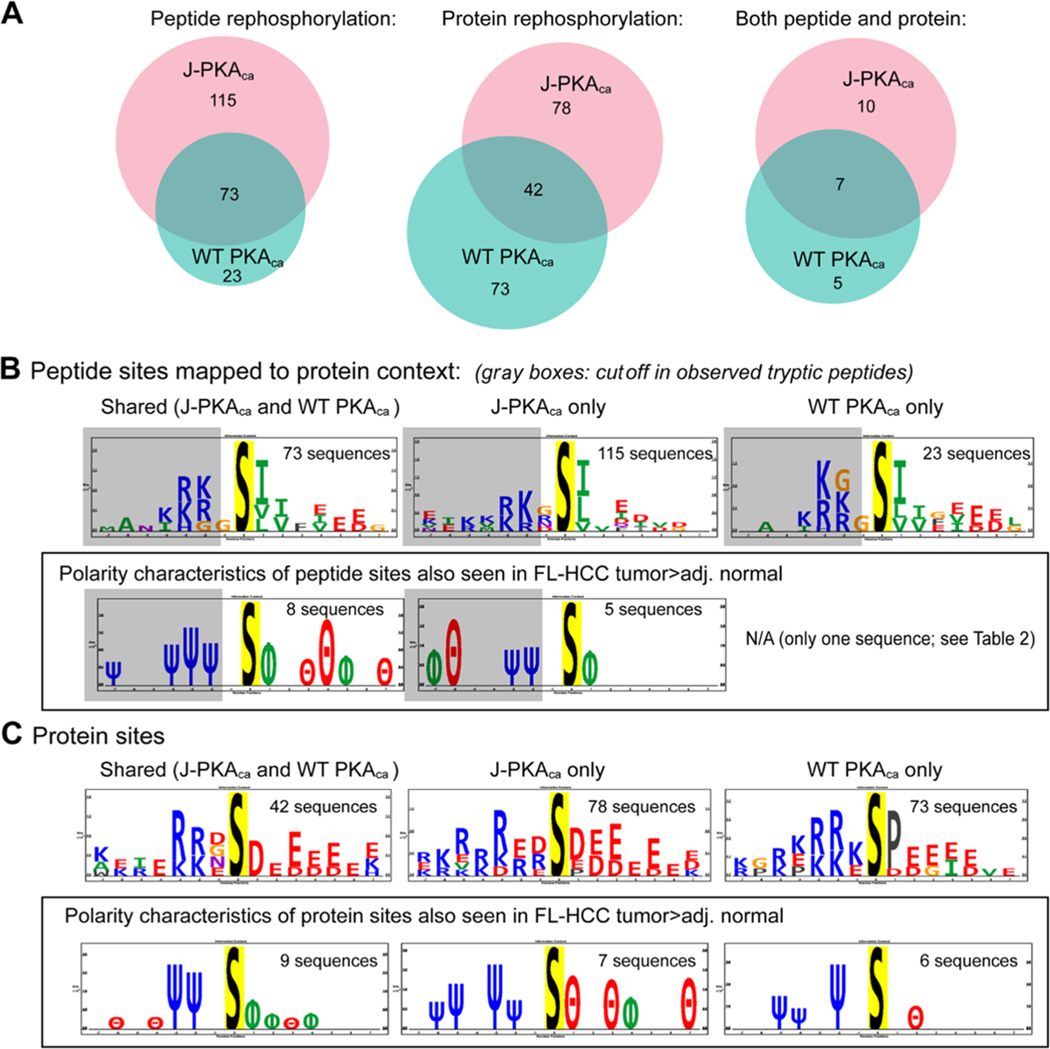
Figure 3.
Peptide and protein rephosphorylation experiments. (A) Venn diagrams illustrating the number of phosphopeptides robustly observed in both replicates of the peptide and/or protein rephosphorylation experiment using recombinant J-PKAca or WT PKAca, showing common and unique peptides for each. (B) Sequence motif analysis using PTM-logo23 (sites mapped to their protein context) for peptide rephosphorylation experiment, overall (top) and highlighting amino acid polarity characteristics for those also seen as higher in FL-HCC tumors by Turnham et al.11 (in a box). Almost all observed phosphopeptides were truncated within 1–2 amino acid N-terminals of the phosphosite (illustrated by gray boxes in sequence logos). Number of sequences used to generate motifs provided for context. (C) Sequence motifs for sites observed by protein rephosphorylation, including all sites observed (top; likely contains upstream/downstream sites as well as direct) and those also seen as more abundant in FL-HCC tumor tissues11 (as for peptide rephosphorylation in a box). Additional detailed information (UniProt identifiers, phosphosites, tc.) provided in Table 2 and Supporting Table S1. Charge logo legend: Ψ = basic residue, e.g., K/R; θ = acidic residue, e.g., D/E; ϕ = hydrophobic residue; P = proline; Δ = other.

