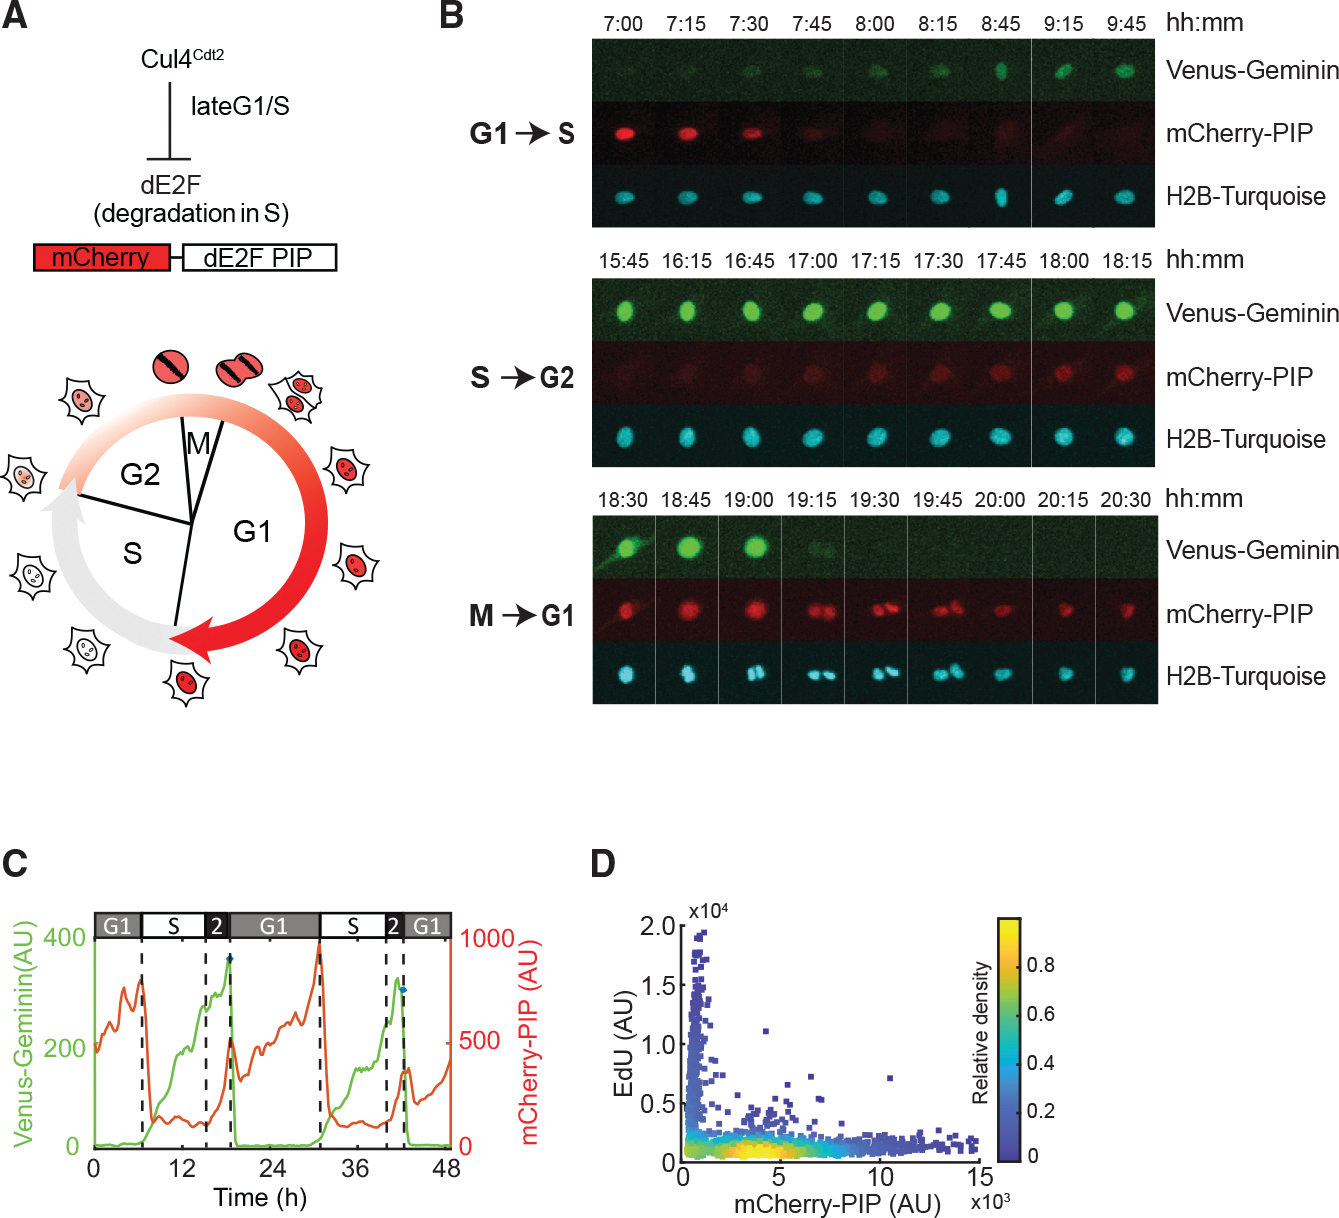
Figure 2. Development and characterization of a live-cell sensor that identifies G1, S, and G2 cell-cycle phases.

(A) (Top) Schematic of S-phase-specific degradation of Drosophila E2F1 PIP-motif-based biosensor. (Bottom) Cell-cycle progression with nuclear mCherry-dE2F PIP fluorescence changes.
(B) Images of a cycling RPE cell expressing Venus-Geminin (1–110), mCherry-dE2F PIP, and H2B-Turq over 24 h. Image strips of these three markers are shown as three panels corresponding to G1-S (top), S-G2 (middle), and M-G1 (bottom) transitions.
(C) Quantification of mCherry-dE2F PIP (red) and Venus-Geminin (1–110) (green) from (B).
(D) Density scatterplots of mCherry-dE2F PIP intensity versus EdU fluorescence intensity. Each dot represents a single cell; .
