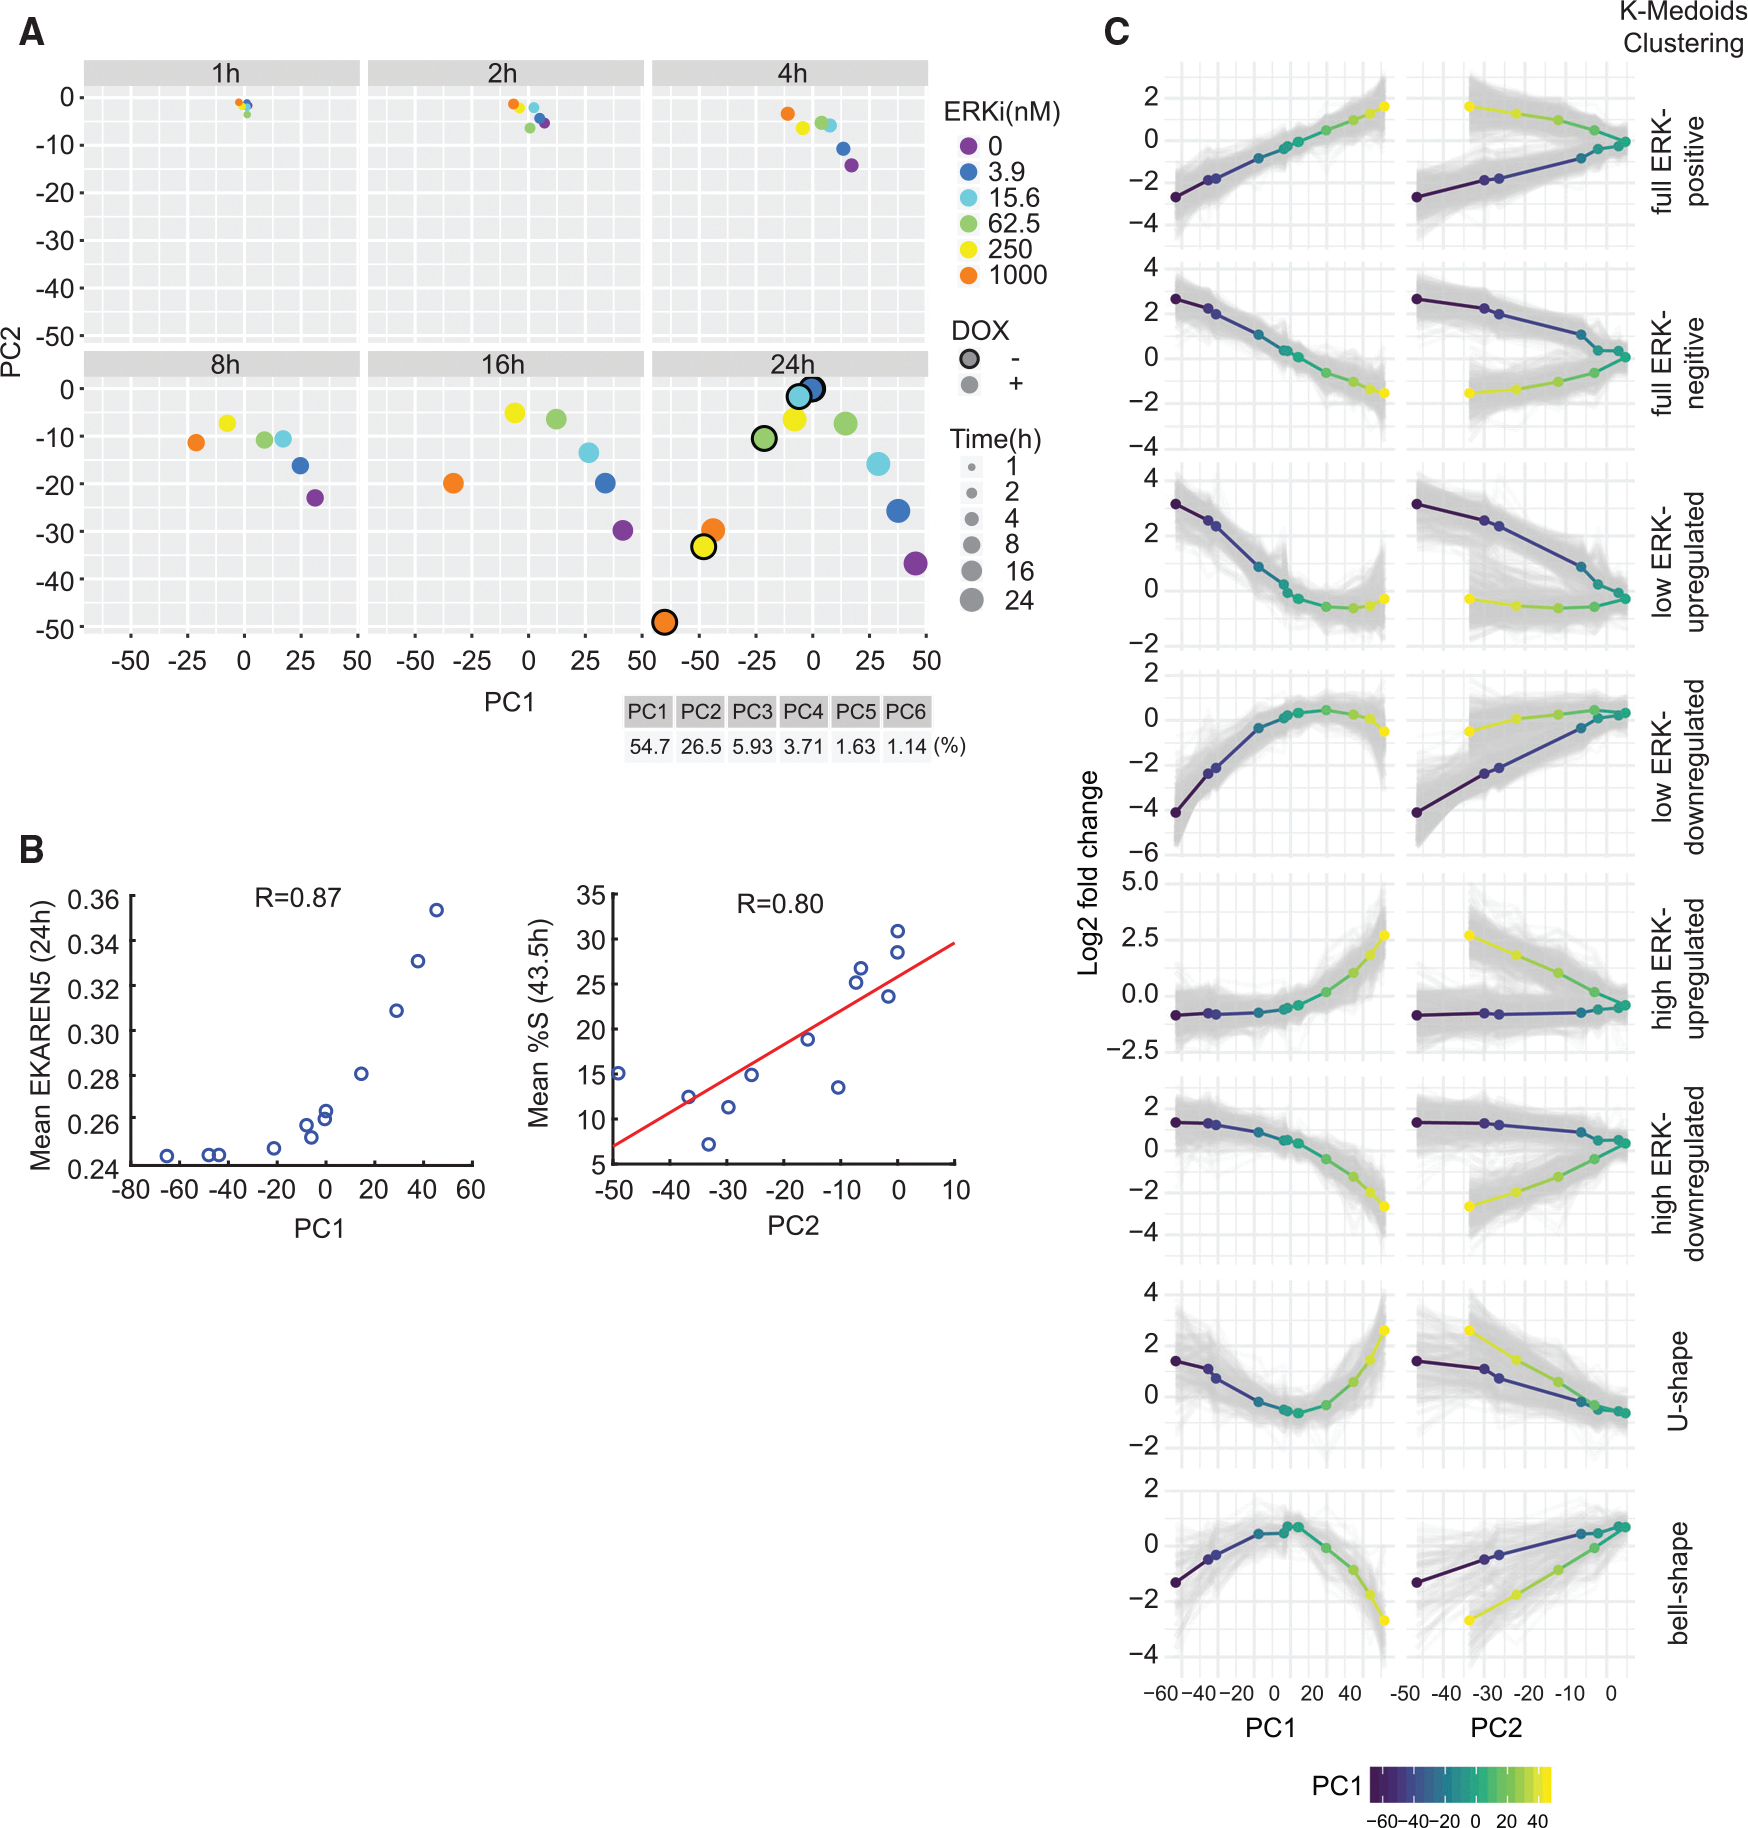
Figure 5. Gene classification by clustering of gene expression reveals different response types to changing levels of ERK activity and proliferation.

(A) Principal-component analysis (PCA) of log2 fold change in gene expression versus untreated control for each treatment (mean of two replicates) from RNA-seq.
(B) BRAFV600E Dual Reporter cells were treated with ERKi (0, 3.9, 15.6, 62.5, 250, 1,000 nM) with or without DOX and imaged for 43.5 h. PC1 values obtained at 24 h in (A) were plotted against the ERK activity measured at 24 h with corresponding treatments from live-imaging experiments. Similarly, PC2 values at 24 h post-treatment were plotted against the percentage of cells in S phase measured at 43.5 h from live-imaging experiments. We chose 43.5 h to account for the time delay between gene expression and cell-cycle entry.
(C) k-medoids clustering of the 1,958 differentially expressed genes identified from RNA-seq experiments. Log2 fold-change expression data of each differentially expressed gene at 24 h were clustered by k-medoids clustering (). Mean expression levels of each cluster are shown as multi-colored lines (blue-yellow represents low-high PC1 values).
