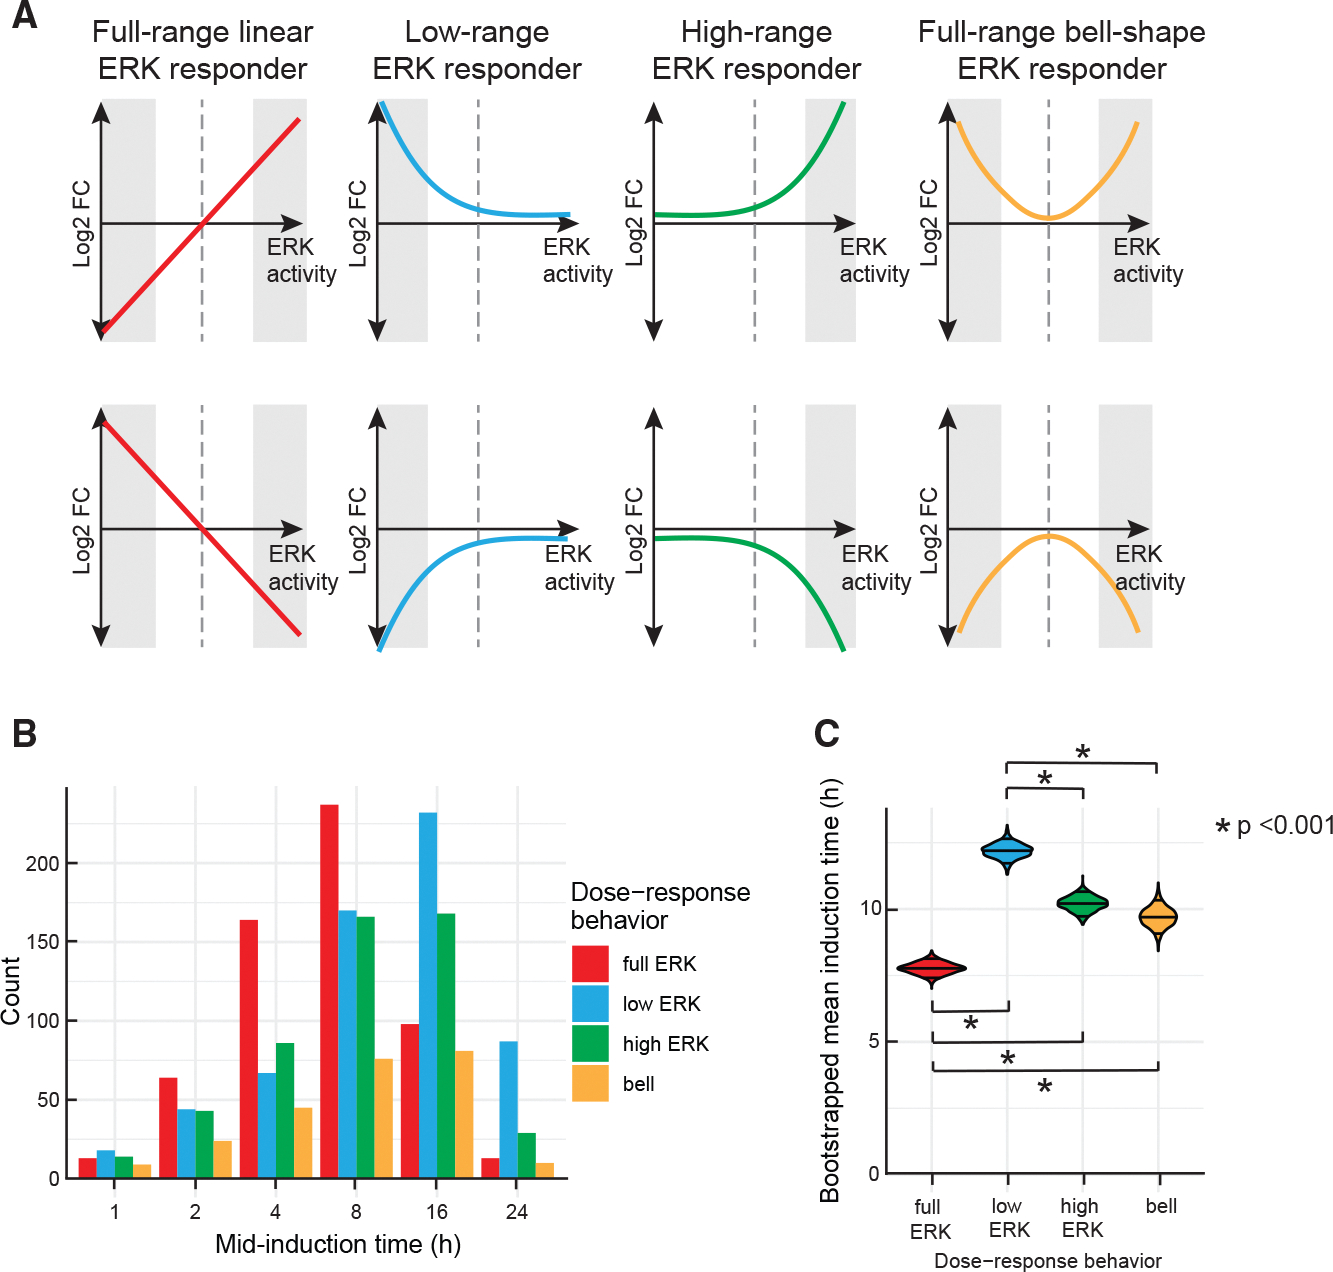
Figure 6. Patterns of ERK-dependent gene expression clustered by ERK activity and time of induction.

(A) Four distinct classes of gene expression patterns as a function of ERK activity. Full-range ERK responders include genes with expression proportional to ERK activity across the entire range of activity levels. Low- and high-range ERK responders show differential gene expression only at the low and high ranges of ERK activity, respectively, while showing minimal response at the opposite end of the range. Full-range bell-shape ERK responders include genes that have a bell- or a U-shaped response, with greatest differential expression at low and high ERK activities. Shaded areas indicate the ERK range in which the class is most responsive. Dashed line marks the ERK activity for untreated cells used for normalization. For illustration purposes, we substituted ERK activity for PC1, since the two are highly correlated.
(B) Temporal dynamics of each class of genes shown in (A) in response to DOX and ERKi treatment. Genes in each class were grouped according to the earliest time point at which they achieved 50% of the maximal change observed over the course of the experiment (see STAR Methods). The time point of mid-induction is shown on the x axis, and the number of genes falling into each category is shown on the y axis.
(C) Mean induction time of ERK responder classes. The violin plot shows bootstrapped estimates of the means for each cluster. Significant differences in the induction time between ERK-response clusters are highlighted with black bars. The p values are derived from ANOVA followed by Tukey’s honest significant difference test.
