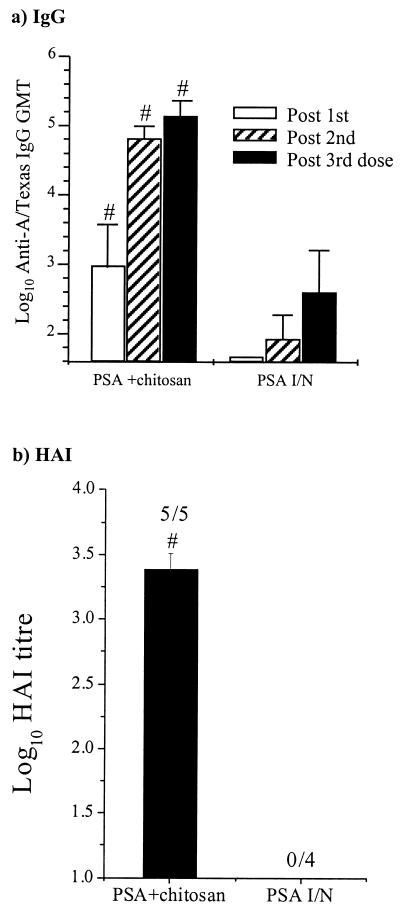
FIG. 3.
Serum antibody response to A/Texas PSA. Mice were immunized, and serum samples were obtained after each immunization as detailed above. (a) Anti-A/Texas IgG ELISA. The columns represent the mean GMTs, and the error bars represent the SEMs. (b) Anti-A/Texas HAI. Columns represent the mean log10 HAIs, and the numbers above the columns show the number of sera giving a positive response per number tested. The means of the different groups were compared to determine if they were significantly different (P < 0.05). #, mean significantly greater than that of the PSA i.n. (I/N) group.

