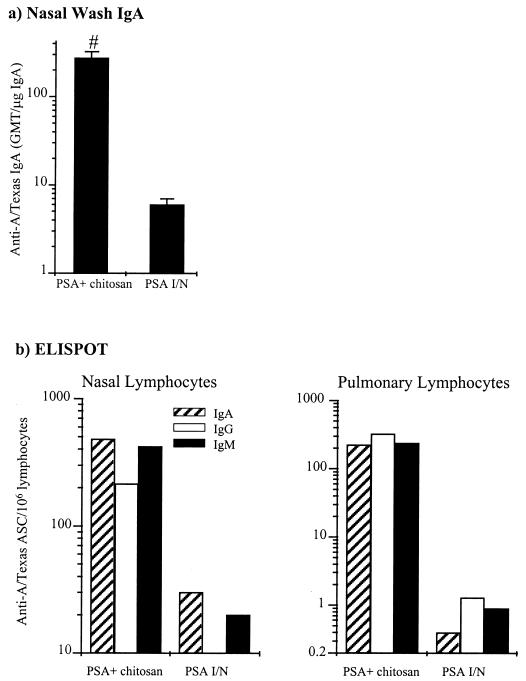
FIG. 4.
Local respiratory antibody response to A/Texas PSA. (a) Nasal-wash anti-anti-A/Texas IgA ELISA. The columns represent the anti-A/Texas IgA GMTs corrected for total nasal-wash IgA, and the error bars represent the SEMs. The means of the different groups were compared to determine if they were significantly different (P < 0.05). #, mean significantly greater than that of the PSA i.n. (“I/N”) group. (b) Respiratory anti-A/Texas ASC response. Anti-A/Texas ASC responses on lymphocytes isolated from the nasal mucosa and lungs were assayed after the third dose by ELISPOT. Columns represent the response of lymphocytes pooled from five mice per group.

