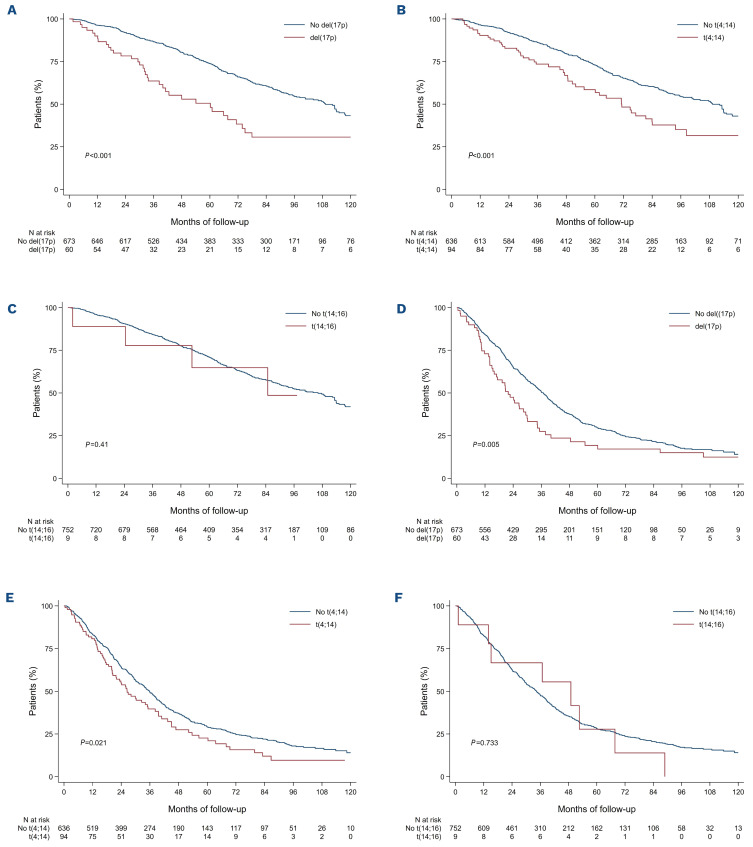
Figure 3.
Kaplan-Meier survival curves according to high-risk cytogenetic abnormalities among Revised International Staging System stage II patients. (A) Overall survival according to del(17p) status. (B) Overall survival according to t(4;14) status. (C) Overall survival according to t(14;16) status. (D) Progression-free survival according to del(17p) status. (E) Progression-free survival according to t(4;14) status. (F) Progression-free survival according to t(14;16) status.

