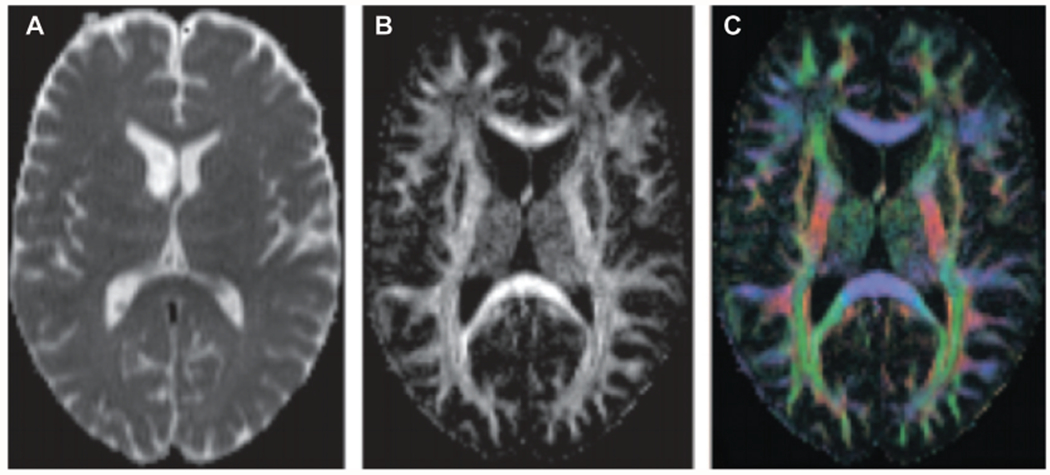
Figure 2.

Example of diffusion tensor imaging maps. (A) Gray-scale mean diffusivity (MD) map generated by whole-brain diffusion tensor estimation and MD computation. (B) Gray-scale fractional anisotropy (FA) map generated by whole-brain diffusion tensor estimation and MD computation. (C) Red, blue, and green color map of the 3 eigenvectors of diffusion tensors. Red, green, and blue represent diffusion on the x-, y-, and z-axes, respectively. Republished with permission from: Hagmann P, Jonasson L, Maeder P, Thiran JP, Wedeen VJ, Meuli R. Understanding diffusion MR imaging techniques: from scalar diffusion-weighted imaging to diffusion tensor imaging and beyond. Radiographics. 2006;26(suppl 1):S205-S223. © Radiological Society of North America.
