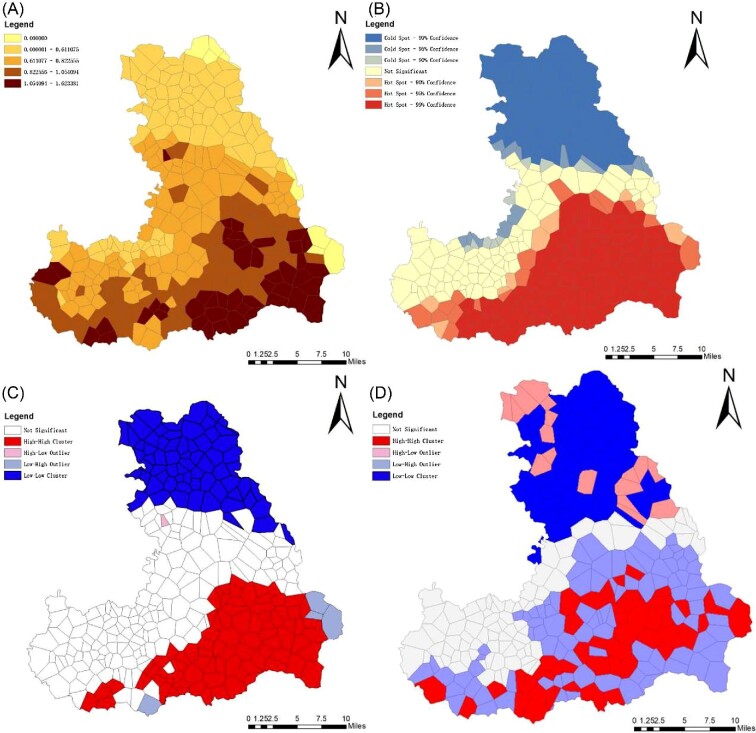
Figure 3.
(A) Distribution of 2007–2012 village-level risk of birth defects in Pingding County. (B) Getis-Ord Gi* spatial hot spots. (C) LISA plot of village-level risk of birth defects in Pingding County. (D) Bivariate LISA plot of village-level risk of birth defects and chemical fertilizer use in Pingding County. Map A shows the spatial distribution of the relative risk of birth defects in Pingding County, identifying a risk region in the south. Map B shows spatial hot and cold spots, indicated by a high-risk clustering region (red marker) and a low-risk clustering region (blue marker). Map C shows a LISA plot where there is low–low clustering (negative autocorrelation, blue markers) in the northern area and high–high clustering (positive autocorrelation, red markers) in the southeast area of Pingding County. Map D shows a bivariate LISA plot indicating that there was a positive association between the risk of birth defects and chemical fertilizer use.

