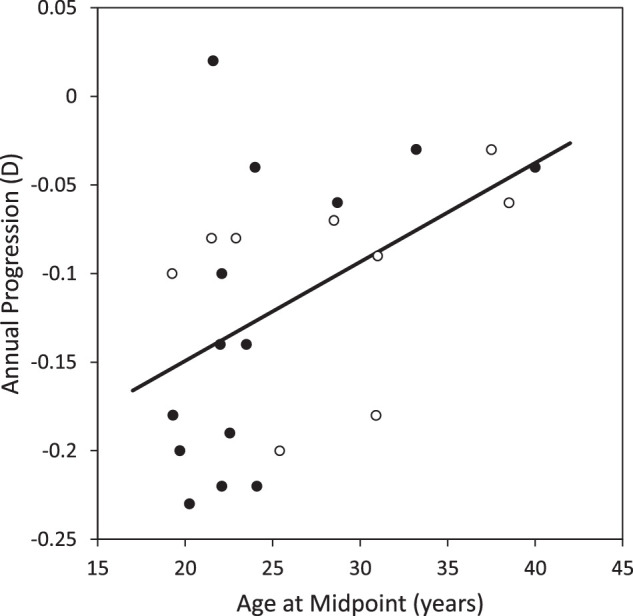
Figure 2.

Mean annual myopia progression as a function of age at the midpoint of the study period. The data are from the 23 of the 25 studies listed in Tables 3 and 4 with data on myopia progression. Closed symbols are data based on cycloplegic refraction. Open symbols are data based on non-cycloplegic refraction.
