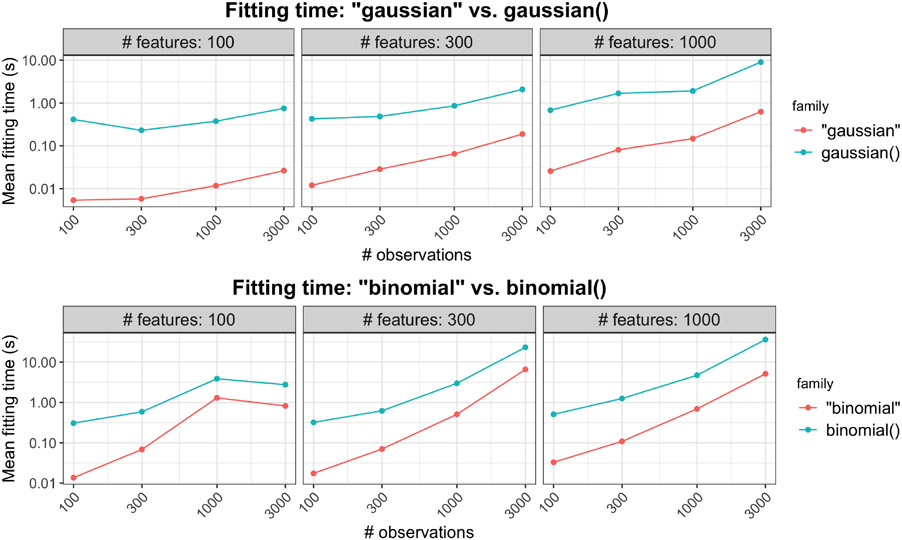
Figure 1:
The top plot compares model fitting times for family = "gaussian" and family = gaussian() for a range of problem sizes, while the plot below compares that for family = "binomial" and family = binomial(). Each point is the mean of 5 simulation runs. Note that both the x and y axes are on the log scale.

