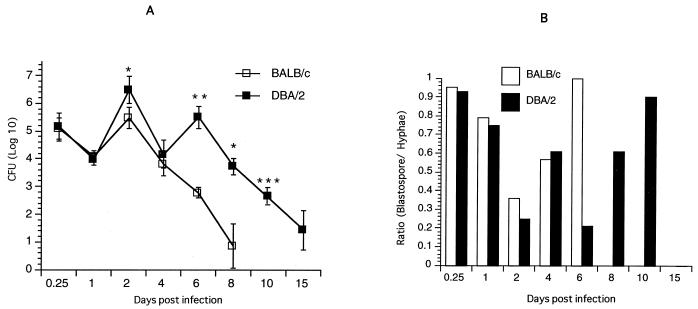
FIG. 1.
Patterns of colonization with C. albicans in BALB/c and DBA/2 mice. (A) Mice were infected by swabbing the oral mucosa with C. albicans (108 CFU/mL). At various times indicated, the level of colonization was assessed by swabbing the oral cavity. Data shown are means ± standard errors for three to five mice. ∗, P < 0.05; ∗∗, P < 0.01; ∗∗∗, P < 0.0001 (for values from BALB/c versus DBA/2 mice). (B) The numbers of blastospore and hyphae in oral tissues were counted by light microscopy (magnification, ×40) after staining with H&E and PAS stains. Data are means ± standard errors for three to five mice.

