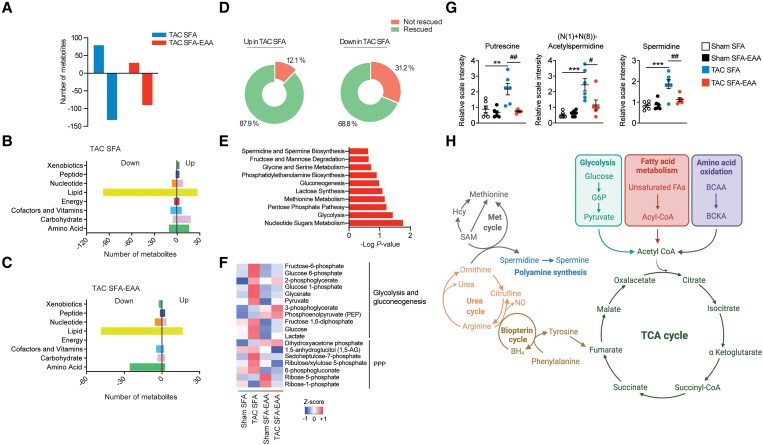
Figure 3.
SFA-EAA diet preserves cardiac metabolism upon pressure overload. (A) Bars represent the number of metabolites significantly upregulated or downregulated (P ≤ 0.05) by TAC in LV of mice fed with SFA and SFA-EAA diet as in Figure 1A (n = 6 mice per group). (B and C) Biochemical classification of metabolites in LV of TAC-operated mice, shown as the number of metabolites for each class significantly modulated by SFA (B) and SFA-EAA diet (C) (n = 6 mice per group). (D) Percentage of metabolites in LV of SFA-fed mice, upregulated (left) or downregulated (right) by the pressure overload and that were rescued or not by the SFA-EAA diet (n = 6 mice per group). (E) Pathway-enrichment analysis of metabolites significantly (P ≤ 0.05) increased upon TAC in the SFA group (n = 6 mice per group). (F) Heatmap of cardiac metabolites showing the levels (red = high, blue = low) of differentially regulated intermediates involved in glycolytic, gluconeogenesis, and pentose phosphate pathway in sham- and TAC-operated mice fed with SFA and SFA-EAA diet (n = 6 mice per group). (G) Polyamine metabolite levels in LV of sham- and TAC-operated mice fed with SFA and SFA-EAA diet. The relative scale intensity was determined by rescaling each metabolite (n = 6) to set the median equal to 1.0. All data are presented as mean ± SEM. **P < 0.01 and ***P < 0.001 vs. sham-operated mice fed with SFA diet; #P < 0.05, ##P < 0.01, and ###P < 0.001 vs. TAC-operated mice fed with SFA diet. Statistical analysis was performed with two-way ANOVA followed by Tukey’s post hoc test (panel G) and Fisher's Exact Test (E). (H) Schematic diagram showing the main metabolic pathways affected by the SFA-EAA diet in cardiac tissue of TAC-operated mice. Diagram was created with BioRender.com.

