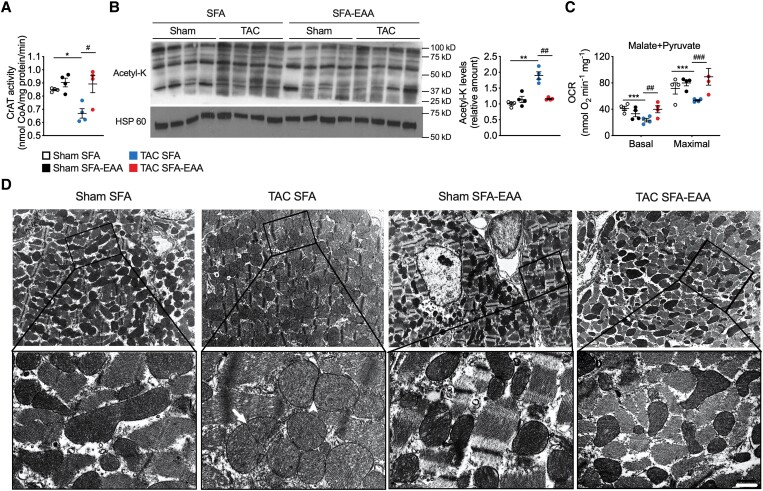
Figure 5.
SFA-EAA diet restores TAC-induced mitochondrial dysfunction and structural damage. (A) Carnitine acetyltransferase (CrAT) activity in LV obtained from sham- and TAC-operated mice fed with SFA or SFA-EAA diet as reported in Figure 1A. CrAT activity is expressed as nmol of free coenzyme A (CoA) released per minute and normalized to mg of total proteins (n = 4 mice per group). (B) Immunoblot analysis and quantification of lysine acetylation (acetyl-K) of total mitochondrial proteins in LV. One experiment representative of three reproducible ones is shown. (C) Oxygen consumption rates (OCRs) in the presence of malate/pyruvate in mitochondria obtained from LV (n = 4 mice per group). Basal: ADP-stimulated respiration (state 3); Maximal: maximal respiration (i.e. the FCCP-induced uncoupled state) (n = 5 mice per group). (D) Transmission electron microscopy images showing the mitochondrial morphology in LV. A magnified view of the regions outlined by the lined boxes is reported below. Globular, swollen mitochondria are predominant in TAC-operated mice fed with the SFA diet, with signs of constriction suggesting early stage (arrow) and late-stage (arrowhead) fission events. Scale bar (shown only in TAC SFA-EAA lower pannel), 1.8 µm (upper pannels) and 0.3 µm (lower pannels) (n = 2 mice per group). All data are presented as mean ± SEM. *P < 0.05, **P < 0.01, and ***P < 0.001 vs. sham-operated mice fed with SFA diet; #P < 0.05, ##P < 0.01, and ###P < 0.001 vs. TAC-operated mice fed with SFA diet. Statistical analysis was performed using two-way ANOVA followed by the Tukey’s post hoc test.

