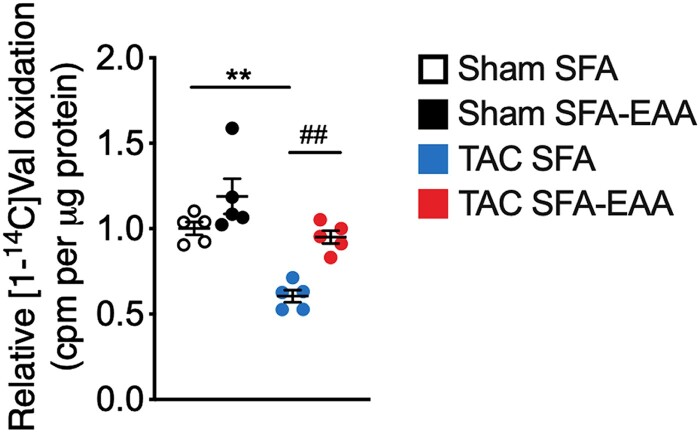
Figure 6.
Valine oxidation rate in LV obtained from sham- and TAC-operated mice fed with SFA or SFA-EAA diet as reported in Figure 1A, normalized to tissue mass (n = 3 mice per group). **P < 0.01 vs. sham-operated mice fed with SFA diet; ##P < 0.01, vs. TAC-operated mice fed with SFA diet using two-way ANOVA followed by the Tukey’s post hoc test.

