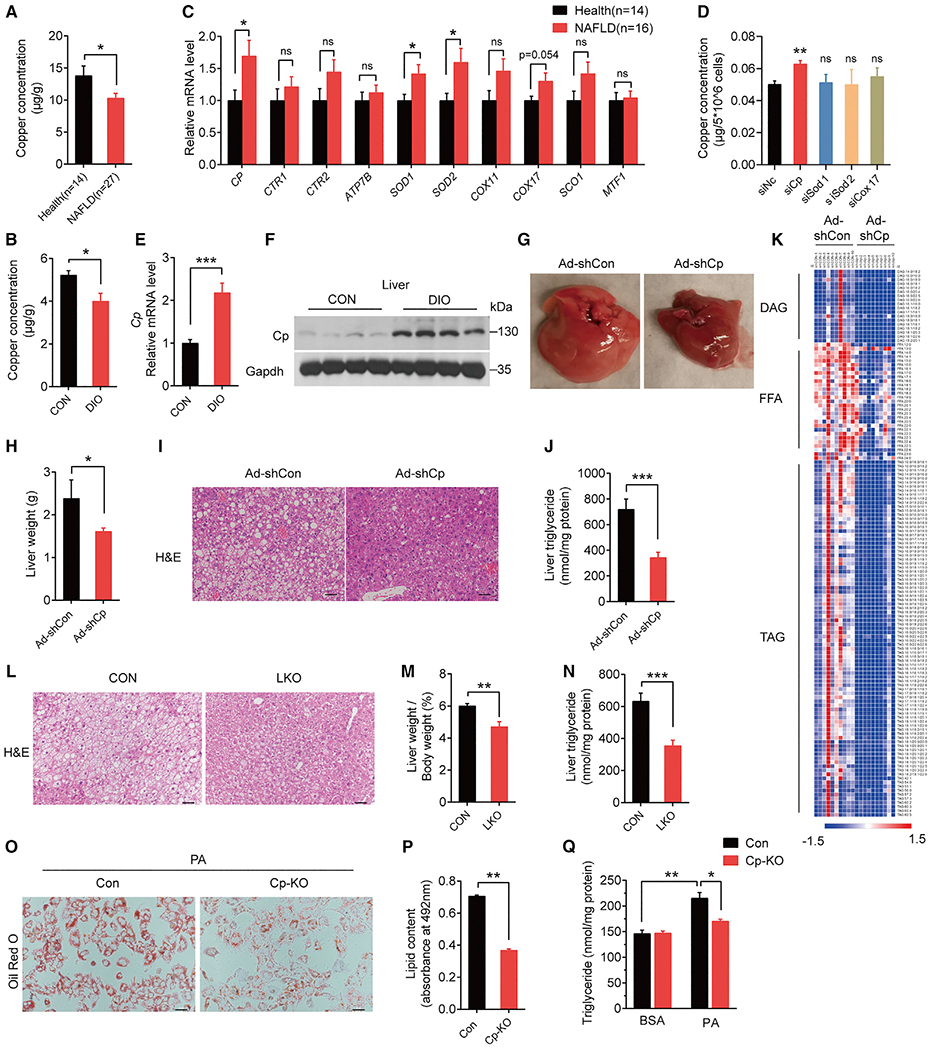
Figure 1. Cp knockdown attenuates HFD-induced hepatic steatosis.

(A) ICP-MS detected hepatic copper concentrations of individuals with NAFLD (n = 27) and healthy controls (n = 14).
(B) Hepatic copper concentrations in DIO and control mice (n = 6 in each group).
(C) qPCR analysis of copper-binding proteins in livers of individuals with NAFLD (n = 16) and healthy controls (n = 14).
(D) Copper concentrations in primary hepatocytes treated with siRNAs.
(E and F) Cp mRNA (E) and protein (F) levels in livers of DIO and control mice.
(G–K) DIO mice (fed an HFD for 13 weeks) were injected with Ad-shCp or Ad-shCon (n = 10 in each group).
(G) Representative images of liver morphology.
(H) Liver weight (g) of mice.
(I) Representative images of hematoxylin and eosin (H&E)-stained liver sections (scale bar: 50 μm).
(J) Hepatic triglyceride concentrations.
(K) Heatmap of hepatic TAG, DAG, and FFA content by LC-MS analysis; each column represents data from a single mouse, and each row represents a lipid species.
(L–N) Liver-specific Cp-knockout mice (LKO) and control mice (Cpflox/flox, CON) fed an HFD for 20 weeks. n = 10 in each group (L) Representative images of H&E-stained liver sections (scale bar: 50 μm).
(M) Liver weight normalized to body weight.
(N) Hepatic triglyceride concentrations.
(O–Q) Primary hepatocytes isolated from LKO and CON mice were treated with PA.
(O) Representative images of oil red O staining.
(P) Lipid content.
(Q) TG concentrations. Data shown in (E) and (O)–(P) are from one representative experiment of at least three independent experiments. Data are presented as mean ± SEM. *p < 0.05, **p < 0.01, ***p < 0.001 compared with the control group. See also Figures S1 and S2, Tables S1, S2, S3, and S4.
