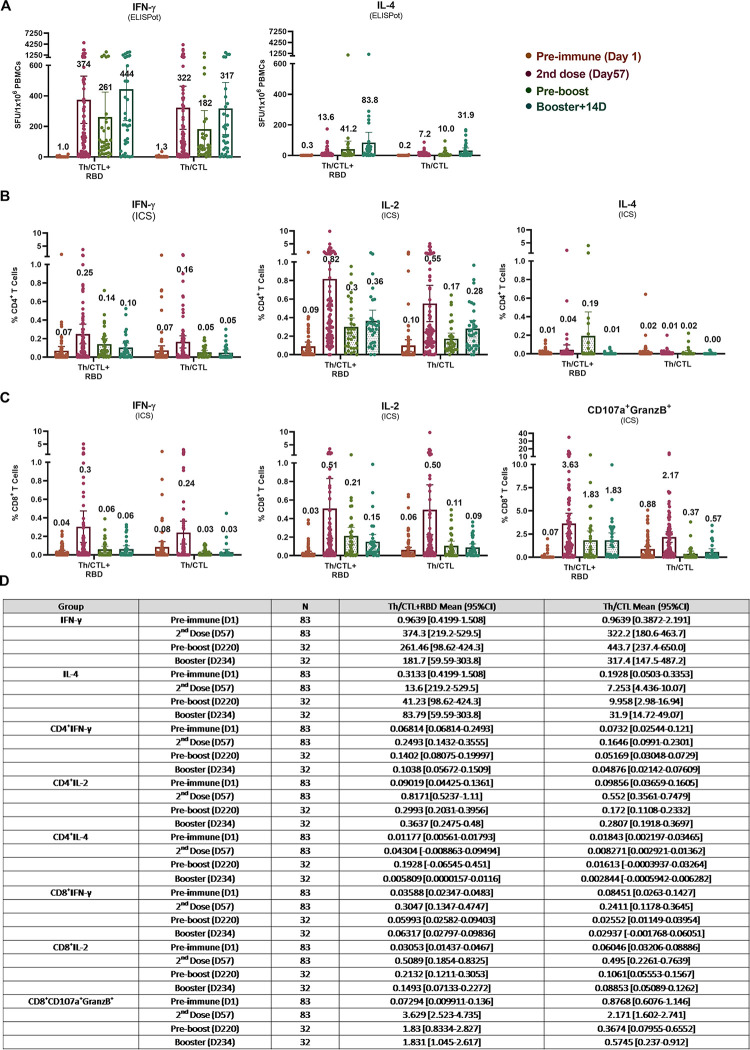
Fig 1. UB-612 induced T cell responses measured by ELISpot and ICS analyses.
T-cell responses to stimulation by epitope peptides (RBD + Th/CTL or Th/CTL alone) were analysed with PBMCs collected from 83 vaccinees from Immunogenicity group (n = 83) on Day 57 (28 days after 2nd dose); and from 32 vaccinees from the Immunogenicity (n = 18) or Safety groups (n = 14) who joined the Phase-2 extension booster study to evaluate the T-cell responses in PBMCs on Days 197 to 242 (pre-boosting days) and Days 211 to 256 (14 days post-booster third dose). T-cell responses were measured by (A) ELISpot at 10-μg/mL per stimulator, in which the Spot-forming units (SFU) per 1×10⁶ PBMCs producing IFN-γ, IL-2 and IL-4 after stimulation with the RBD + Th/CTL peptide pool or the Th/CTL peptide pool are expressed. The PBMC samples stimulated with Th/CTL+RBD were also evaluated for T cell responses by (B) Intracellular Staining (ICS), by which the %CD4+ T cells producing IFN-γ, IL-2 and IL-4; and (C) %CD8+ T cells producing IFN-γ, IL-2 and CD107a+Granzyme B+ in response to the stimulation by RBD+Th/CTL peptide pool or the Th/CTL peptide pool are shown. (D) Summary of mean and 95% CI are presented for plots as shown in panels (A) to (C). Horizontal bars indicate mean with 95% CI.

