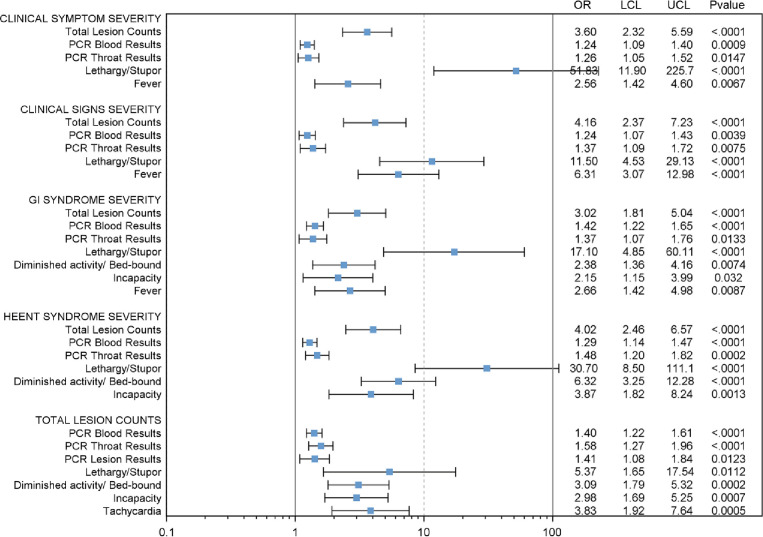
Fig 8. Forest Plot showing statistically significant associations.
Odd ratio (OR), upper 95% confidence interval (UCL), and lower 95% confidence interval (LCL) were calculated using separate generalized estimating equations (GEE) with cumulative logit models, day after rash onset was adjusted as covariate. Adjusted p value were calculated using stepdown Bonferroni correction if needed. Only significant results are showed here (p value ≤ 0.05).

