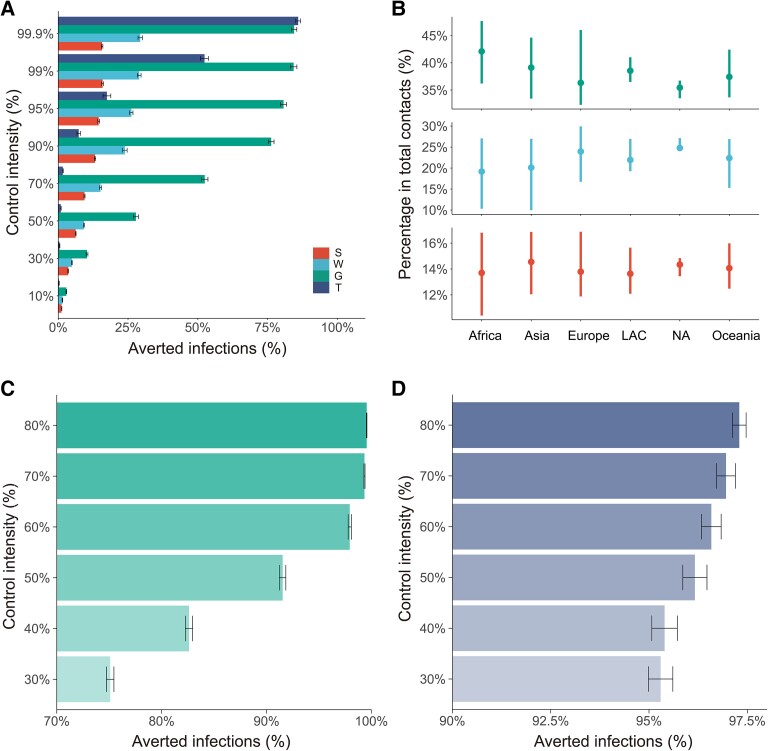
Fig. 3.
Global effects of NPIs. A) Averted first-year infections of each NPI with different control intensities. S, W, and G indicate the reduction of social contacts in schools, workplaces, and general communities, respectively; T indicates travel restrictions. B) Percentage of contacts in schools (red), workplaces (blue), and general communities (green) summarized in global regions. Dots indicate the mean value in each region; bars indicate the 95% CIs. LAC represents Latin America and the Caribbean region, and NA represents the Northern American region. C) Effects of combined NPIs with school closure (100% school contact reduction), 90% travel restrictions, and different intensities of contact reductions in workplaces and general communities. The y-axis denotes contact reductions in workplaces and general communities. D) Effects of combined NPIs with 70% contact reductions in school, workplace, and general communities and different intensities of travel restrictions. The y-axis denotes percentages of travel restrictions.

