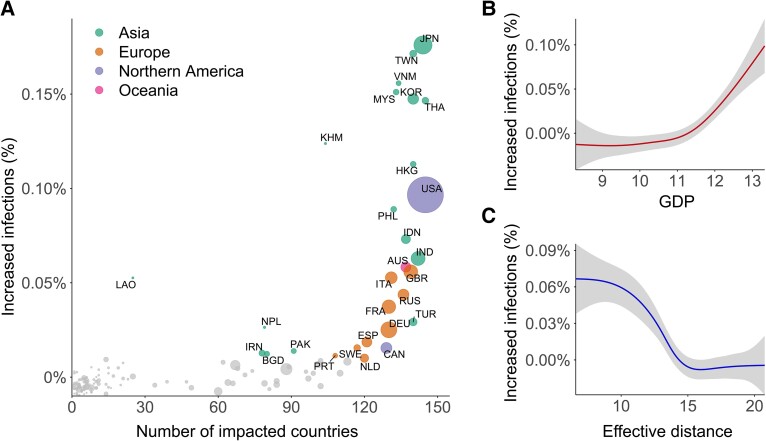
Fig. 4.
The impact of passive strategies. A) Scatterplot of the number of significantly impacted countries (x-axis) and increased infections in the rest of the countries (y-axis) in the first year if the NC country takes no control. Dot size indicates the relative size of each country's gross domestic product (GDP) in 2019. Dot color indicates countries in different geographic regions. Gray dots indicate that the global impacts of corresponding countries are not significant at 95% CIs. B) The relationship between increased infections and the GDP of NC country. C) The relationship between increased infections and the effective distance of the NC country to the seed origin. In B) and C), the gray area indicates 95% CIs.

