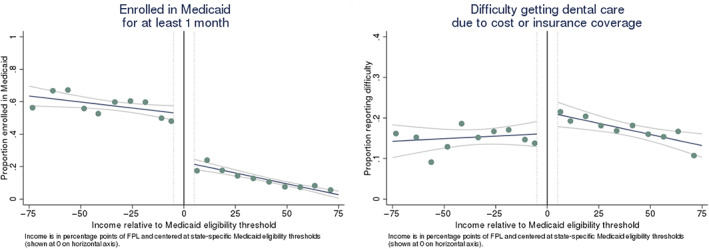
FIGURE 1.

Enrollment in Medicaid and difficulty obtaining dental care due to cost or insurance coverage as a function of income. Graphs show the proportions of Medicare beneficiaries enrolled in Medicaid (left panel) and who reported difficulty getting dental care due to cost or insurance coverage (right panel) as a function of income relative to state‐specific Medicaid eligibility thresholds (pooled across states). Income is measured in percentage points of the federal poverty level (FPL) and centered at state‐specific Medicaid income eligibility thresholds (shown at 0 on horizontal axis). Estimated and reported for 20 equally sized income bins. We omitted individuals within ±5 percentage points of Medicaid eligibility thresholds, shown as dotted vertical lines in the figure, to mitigate attenuation bias from differences in how income may be reported to state Medicaid programs versus in the MCBS (e.g., differences in lookback periods). Fitted regression lines and 95% confidence intervals overlaid on the scatterplots show the relationship between income and outcomes above versus below Medicaid income eligibility thresholds. The vertical distance between the fitted lines at the Medicaid eligibility threshold gives the discontinuity in the outcome (without adjustment for covariates). Estimates are adjusted for survey weights. Based on 7508 observations from the 2016–2019 MCBS. When weighted, this sample represented 26,776,719 beneficiary‐years in the community‐dwelling Medicare population. See Appendix (Supporting information) for plots of other study outcomes [Color figure can be viewed at wileyonlinelibrary.com]
