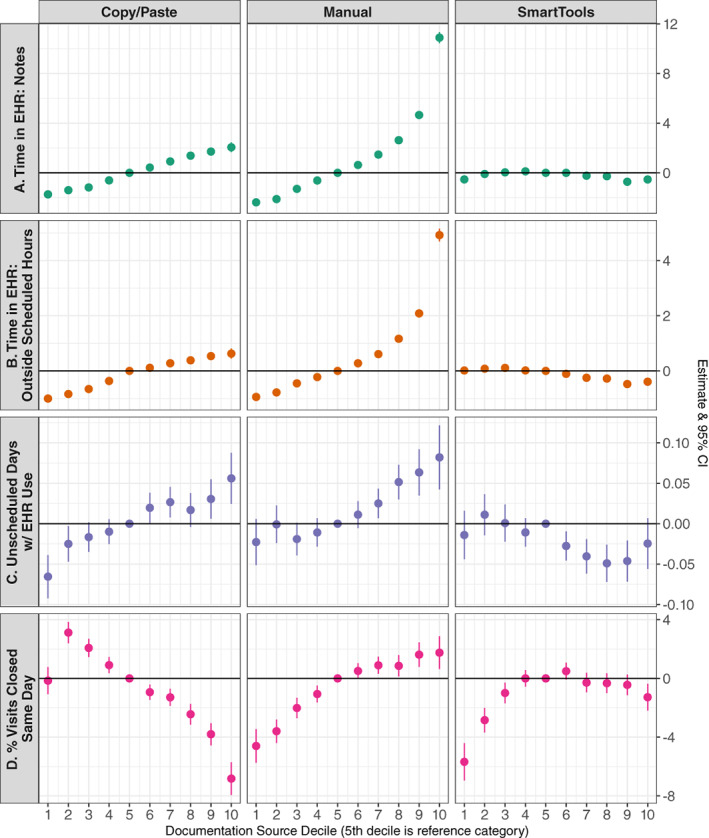
FIGURE 3.

Relationship between note composition tool use and physician burden and efficiency. Each row displays findings from a single multivariable ordinary least‐squares regression model adjusting for additional deciles of note source (transcription, voice recognition, and NoteWriter), physician case load (average visits per week) and case mix complexity, and organizational factors. For each note text source, the fifth decile is used as the reference category to obtain estimates for physicians in each decile of note content from each of the three featured text sources. Each of the four outcomes on the left side represent some aspect of physician burden. Units for panels (A, B) are minutes per visit; unit for panel (C) is days per week; unit for Panel (D) is percentage points. Full regression results for all models can be found in Appendix Table 2. [Color figure can be viewed at wileyonlinelibrary.com]
