
Figure 3.
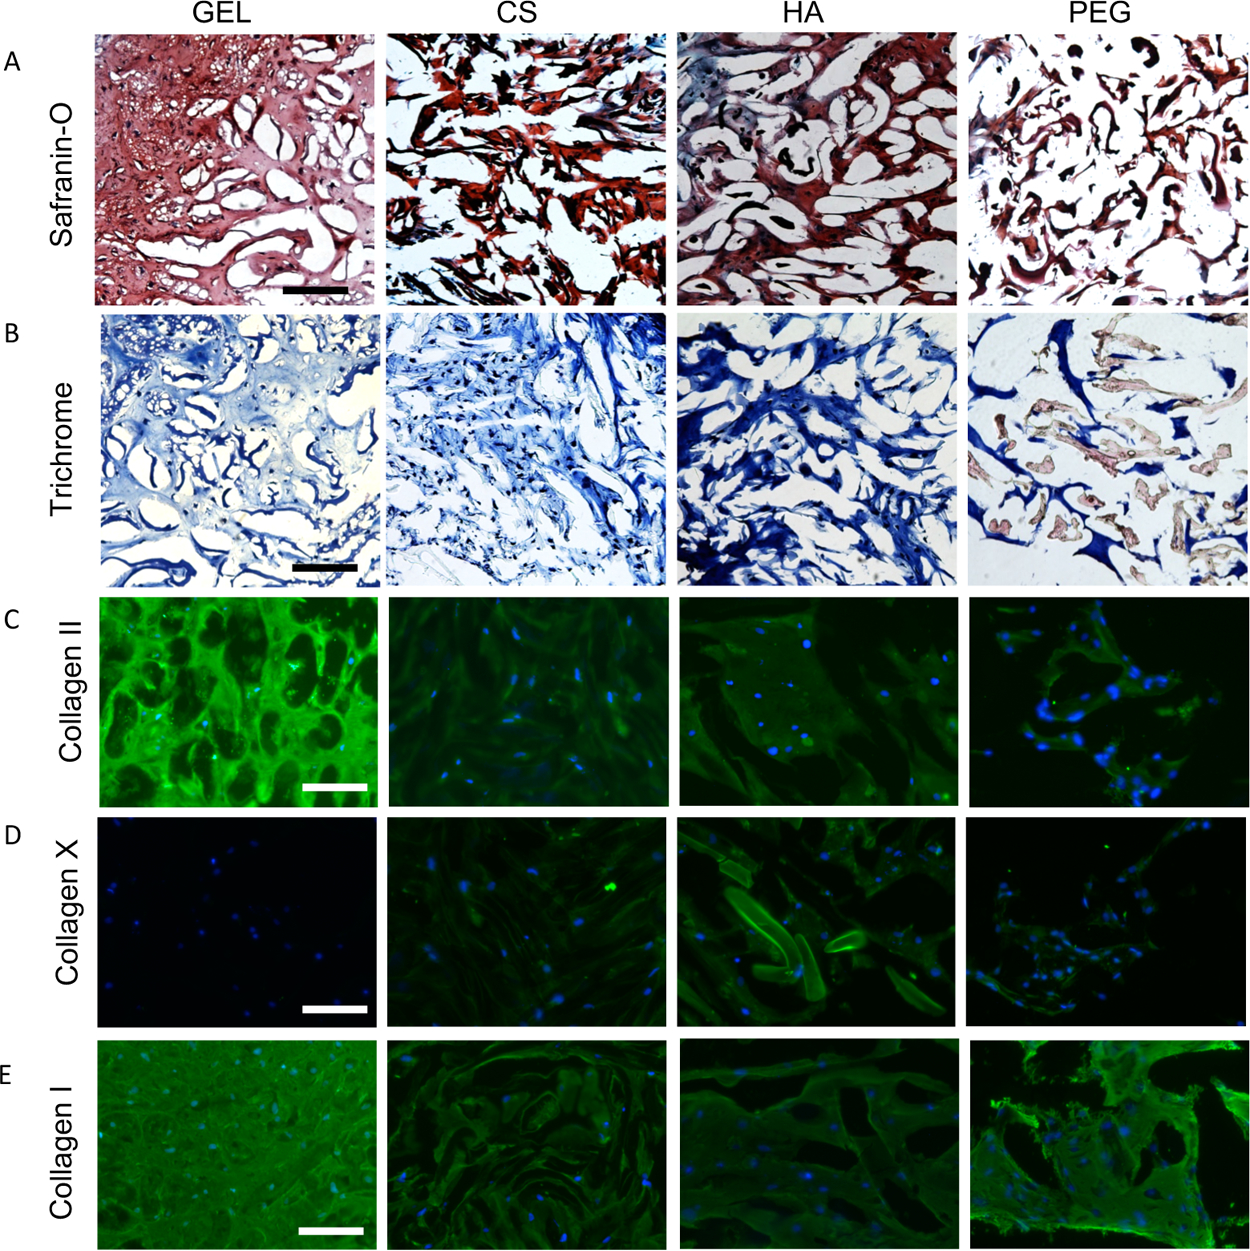
Histologic staining of constructs to visualize distribution of cartilage ECM deposition after 21 days in chondrogenic medium. (A) Safranin-O staining to visualize sGAG and (B) Masson’s trichrome staining to visualize collagen. Immunostaining of (C) collagen II, articular cartilage marker, (D) collagen X, hypertrophic cartilage marker, and (E) collagen I, fibrocartilage marker. Scale bars: (A–B) 200 and (C–E) 100 μm.