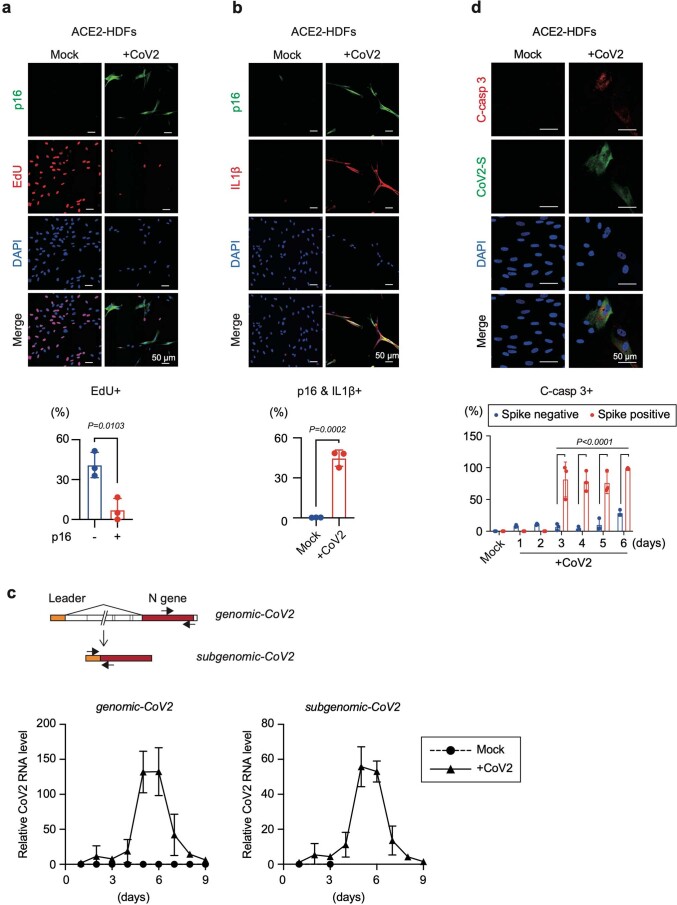
Extended Data Fig. 2. Signs of cellular senescence induced by SARS-CoV-2 infection.
a and b, ACE2-HDFs were infected with (CoV2) or without (Mock) SARS-CoV-2 at MOI of 1.0 for 9 days. Immunofluorescence analysis of p16INK4a expression [green], EdU incorporation [red], and DAPI [blue] (a), p16INK4a expression [green], IL-1β [red], and DAPI [blue] (b) were shown. Histograms show the percentage of EdU positive in p16INK4a negative (-) or positive (+) cells (a), double-positive cells for p16INK4a expression, and IL-1β expression in Mock or CoV2 (b) on day 9 after SARS-CoV-2 infection. c, Schematic diagram of the genome (genomic-CoV2) and subgenomic (subgenomic-CoV2) RNAs and the positions of the RT-qPCR primers used. ACE2-HDFs infected with (CoV2) or without (Mock) SARS-CoV-2 at MOI of 1.0. were subjected RT-qPCR for genomic-CoV2 and subgenomic-CoV2 every day from day 1 to 9. d, SARS-CoV-2-infected ACE2-HDFs were subjected to immunofluorescence staining for cleaved caspase-3 (C-casp 3) [red], SARS-CoV-2 spike protein (CoV2-S) [green], and DAPI [blue] at indicated time point. A representative photograph at day 4 post-infection was shown (Scale bars, 50 μm). The histograms indicate the percentages of cleaved caspase-3 expressing cells with or without SARS-CoV-2 spike protein for every day from day 1 to 6 post-infection. For all graphs, error bars indicate mean ± standard deviation (s.d.) of biological triplicate. Statistical significance was determined using two-tailed unpaired Student’s t test in (a) and (b), and with two-way ANOVA followed by sidak’s multiple comparison test in (d).

