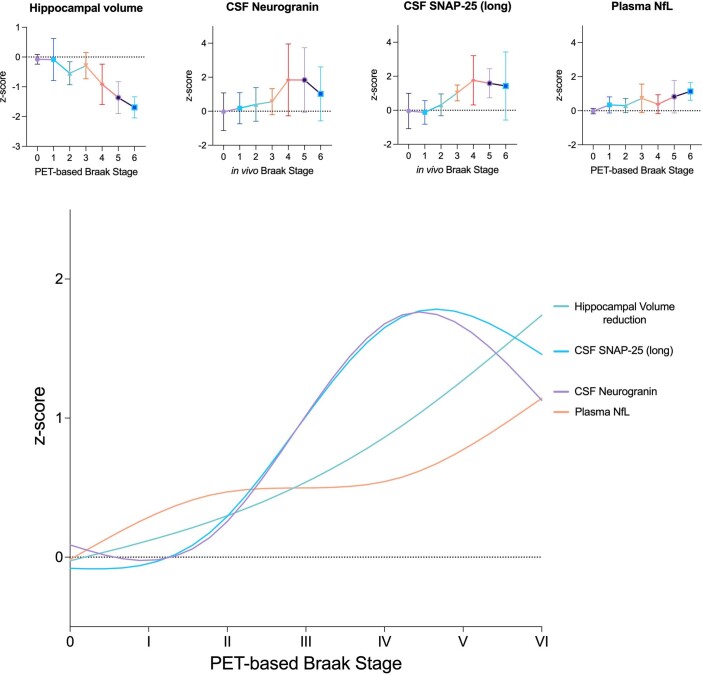
Extended Data Fig. 5. PET-based Braak stage is associated with imaging, CSF and plasma measures of neurodegeneration.
Top: Individual neurodegeneration biomarkers represented with 95% Confidence Intervals. MRI-measured hippocampal volume (adjusted for intracranial volume) increased in severity starting at stage II onwards (n = 324 individuals). Fluid neurodegeneration biomarkers increase with advancing PET-based Braak stage. CSF measurements of SNAP-25 (long) and neurogranin increased at stages III–IV (189 individuals with CSF measurements). No differences were observed between stages 0, I and II. Substantial within-stage variability was observed for plasma NfL (n = 292 individuals). No differences were observed between stages 0, I and II. Both fluid and imaging neurodegeneration biomarkers showed substantial within-stage variability, potentially reflecting the fact that neurodegeneration is a multifactorial process, influenced by factors other than tau-mediated neurodegeneration. Bottom: Neurodegeneration biomarker curves superimposed according to PET-based Braak stage. Note that Hippocampal volume was inverted in order to compare the degree of abnormality.

