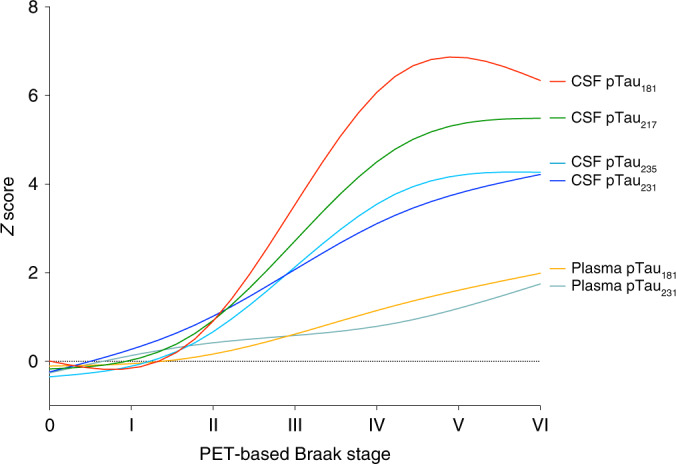
Fig. 3. PET-based Braak stages reflect the evolution of soluble pTau species.

Measures of four soluble pTau epitopes demonstrate differential evolution with respect to PET-based Braak stage. Magnitude of CSF pTau changes mirror the spatial extent of neurofibrillary tangle pathology. At Braak stage I, when tau abnormality is confined to the transentorhinal cortex, there are no statistically significant differences in any CSF or plasma pTau measures with individuals who are at Braak stage 0. At Braak stage II, small differences in the concentrations of CSF pTau231, pTau217, pTau235 and pTau181 are present. Starting at Braak stage III, when abnormal tau begins to accumulate outside the medial temporal lobe, CSF measures of pTau epitopes begin to show substantial increases. Larger differences in the magnitude of CSF pTau231 were observed at earlier stages, whereas larger differences in CSF pTau181 were observed at later stages. In contrast of CSF measurements, plasma measures of pTau show more modest increases across Braak stages, with plasma pTau231 becoming abnormal before plasma pTau181. The magnitude of pTau181 abnormality was largest at PET-based Braak stages IV–VI. CSF pTau measures exhibited plateaus at late Braak stages, whereas plasma pTau measures continued to increase. Curves were fit with locally estimated scatterplot smoothing (LOESS) regression. Summary statistics for all pTau comparisons are reported in Supplementary Table 3. Biomarker curves with 95% confidence intervals are displayed in Extended Data Fig. 3.
