
Fig. 5. AD biomarker abnormalities in relation to the topography of cerebral tau pathology.
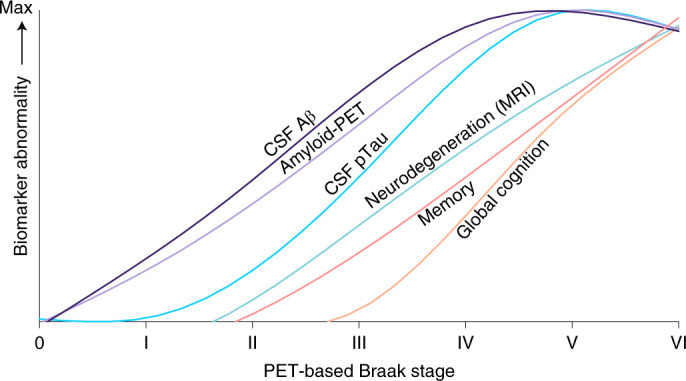
Summary of data-driven AD biomarker abnormalities from the perspective of PET-based Braak staging. Trajectories of scaled biomarker data are fitted with LOESS regression. In this conceptual framework, the x axis represents Braak stage and not time. Therefore, unlike other AD biomarker models, the x axis is not indented to represent the linear temporal evolution of AD and instead displays multiple AD pathophysiological changes in relation to the spatial distribution of tau pathology measured with tau-PET. Similar to other models, biomarker curves represent group-level biomarker changes, and individual-level variability is expected (i.e., Braak stages I and II were compatible with both amyloid-β positivity and negativity at the individual level). However, even in the tau-centric framework, detectable CSF and PET continuous measures of amyloid-β preceded elevated pTau concentrations measured in CSF. CSF pTau abnormality accelerated dramatically between Braak stages III and VI. Neurodegeneration indexed by hippocampal volume was closely followed by memory dysfunction. Dysfunction in global cognition rose slightly around stages III–VI and more dramatically at stages V–VI. PET-based Braak staging also provides a framework for testing new biomarkers.