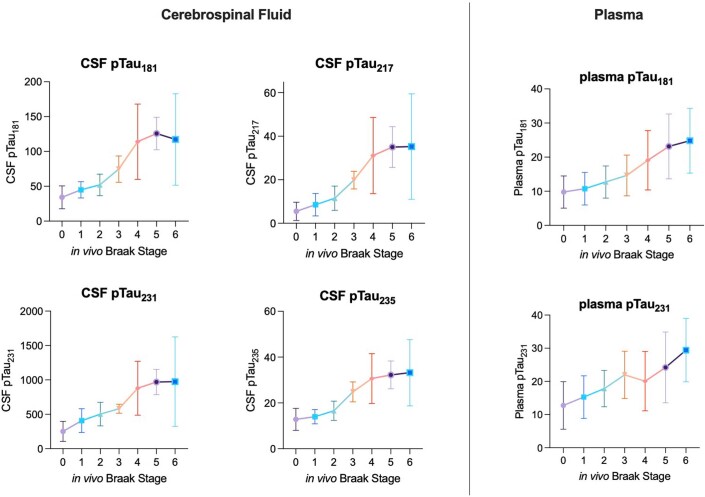
Extended Data Fig. 3. Phosphorylated tau species curves displayed with 95% Confidence Intervals.
Left: CSF biomarkers of pTau epitopes increase with respect to PET-based Braak stages. For all CSF pTau epitopes, modest differences were observed at early Braak stages, likely reflecting the fact that only subtle pathological changes are occurring in the cerebral cortex. No differences were observed between stages V and VI for any CSF pTau measures (n = 189 individuals with lumbar punctures). Right: Plasma biomarkers of pTau181 and pTau231 increase with advancing PET-based Braak stage. Despite stepwise increases at the group level, large within-stage variability exists for each fluid pTau biomarker in each Braak stage. Means are represented by shapes and error bars indicate 95% CIs (n = 292 individuals with plasma pTau assessments).

