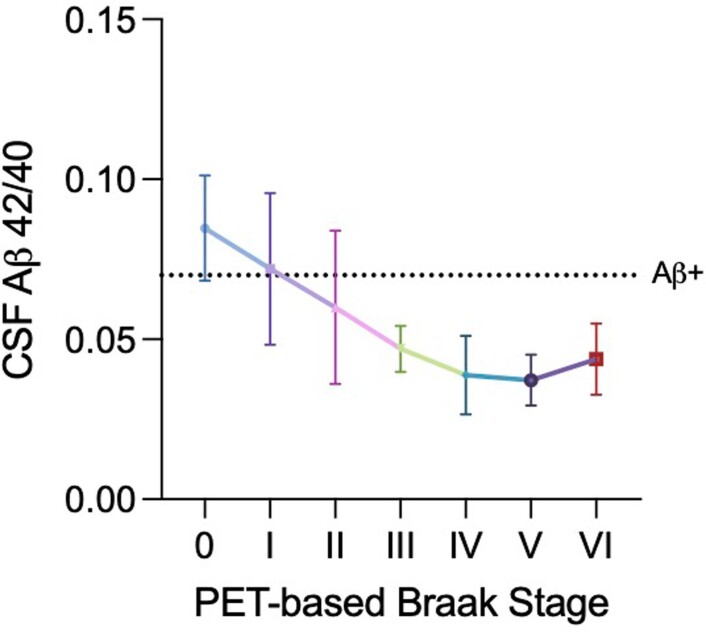
Extended Data Fig. 4. Braak stages evolve with respect to CSF amyloid-β concentrations.
Means are represented by shapes and error bars indicate standard deviation. Dashed line represents a previously validated threshold for amyloid positivity. Similar to amyloid-PET data, most individuals at Braak stage 0 were amyloid negative. PET-based Braak stages I and II were compatible with both amyloid positivity and negativity. A higher proportion of individuals were CSF amyloid-positive at stage II and were amyloid-PET positive at stage II. A plateau of amyloid abnormality was observed at late Braak stages. 189 individuals had CSF measurements available.

