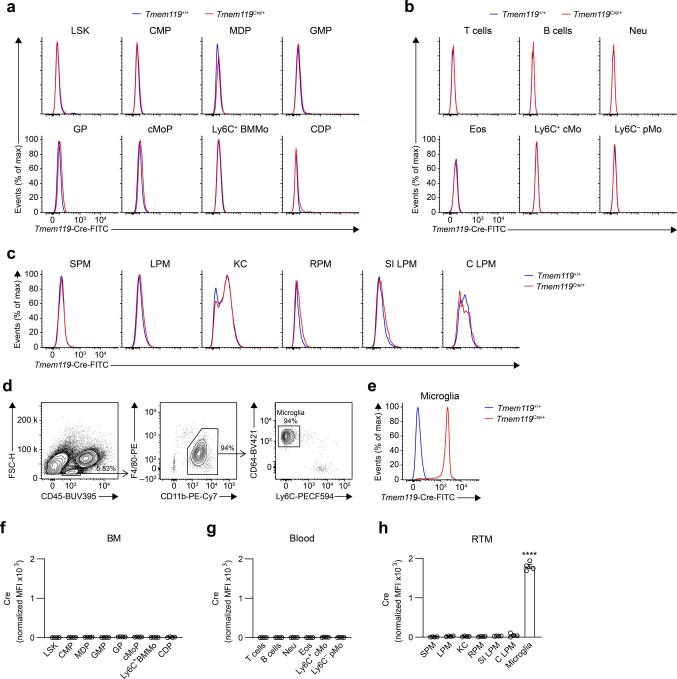
Extended Data Fig. 2. Assessment of intracellular Cre protein expression in BM progenitors, blood leukocytes and RTM.
a-c, Representative histograms of Cre intracellular expression in BM progenitors, as in Extended Data Fig. 1b,c (a), in blood leukocytes, as in Extended Data Fig. 1d (b), and in small and large peritoneal macrophages (SPM and LPM, respectively), Kupffer cells (KC), red pulp splenic macrophages (RPM), small intestinal (SI) and colon (C) lamina propria macrophages (LPM), as in Extended Data Fig. 1e-i (c) from Tmem119+/+ (blue) and Tmem119Cre/+ (red) mice. d, Flow cytometry gating strategy to show brain FSCloCD45intF4/80+CD11b+CD64+Ly6C− microglia. e, Representative histograms of Cre intracellular protein expression in microglia from Tmem119+/+ (blue) and Tmem119Cre/+ (red) mice. f-h, Bar graphs showing normalized Cre expression in the indicated cell populations from the BM (f) and the blood (g), and in tissue RTM (h). Data show mean ± SEM (n = 4 mice per group). In h, P values compare microglia vs. every other population and were calculated using a one-way analysis of variance (ANOVA) with Tukey’s post hoc tests. Raw data and P values are provided as a source data file. ****, P < 0.0001. CDP, common plasmacytoid and dendritic cell progenitor; cMoP, common monocyte progenitor; CMP, common myeloid progenitor; GMP, granulocyte-monocyte progenitor; GP, granulocyte progenitor; LSK, lineage(Lin)−Sca-1+cKit+ multipotent progenitor; MDP, monocyte-dendritic cell progenitor.

