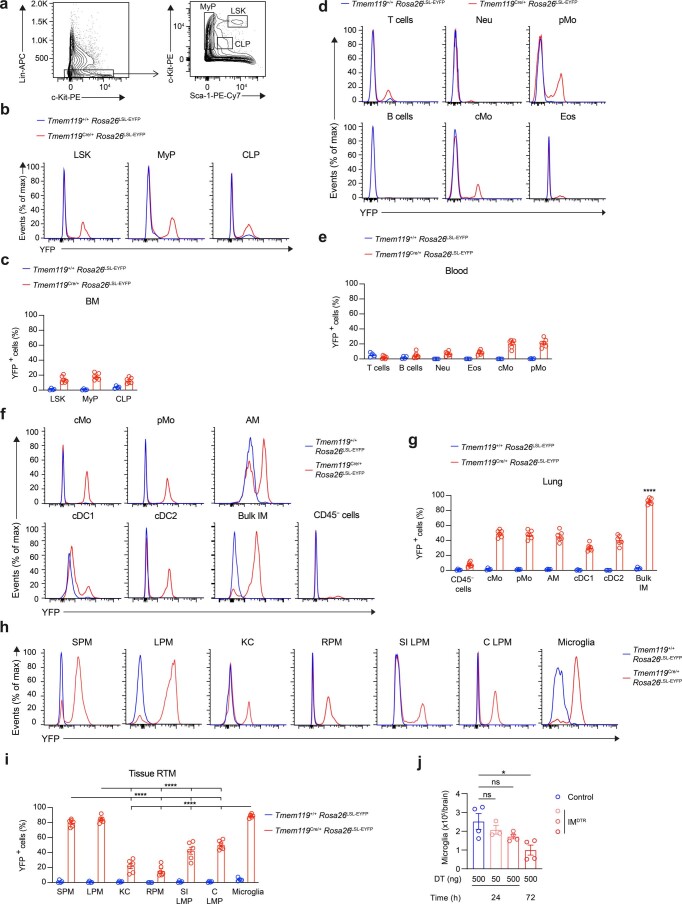
Extended Data Fig. 3. Assessment of YFP labeling in Tmem119CreRosa26LSL-EYFP mice and of microglia depletion in IMDTR mice.
a, Flow cytometry gating strategy to show Lineage(Lin)−Sca-1+c-Kit+ (LSK) multipotent progenitors, Lin−Sca-1−c-Kitint/hi myeloid lineage-committed progenitors (MyP) and Lin−Sca-1intc-Kitint common lymphoid progenitors (CLP). b-c, Representative histograms of YFP expression (b) and bar graphs showing % of YFP+ cells (c) in BM LSK, MyP and CLP (c) from Tmem119+/+Rosa26LSL-EYFP (blue) and Tmem119Cre/+Rosa26 LSL-EYFP (red) mice. d-e, Representative histograms of YFP expression (d) and bar graphs showing % of YFP+ cells (e) in blood CD45+CD3+CD19− T cells, CD45+CD3−CD19+ B cells, CD45+CD3−CD19−Ly6G−SiglecF−CD115+ Ly6C+ cMo or Ly6C− pMo, CD45+CD3−CD19−Ly6G+CD11b+ neutrophils (Neu), CD45+CD3−CD19−CD11b+SiglecF+ eosinophils (Eos) from Tmem119+/+Rosa26LSL-EYFP (blue) and Tmem119Cre/+Rosa26 LSL-EYFP (red) mice. f-g, Representative histograms of YFP expression (f) and bar graphs showing % of YFP+ cells (g) in lung cMo, pMo, cDC1, cDC2, AMs, IMs and CD45− structural cells from Tmem119+/+Rosa26LSL-EYFP (blue) and Tmem119Cre/+Rosa26 LSL-EYFP (red) mice. h-i, Representative histograms of YFP expression (h) and bar graphs showing % of YFP+ cells (i) in small and large peritoneal macrophages (SPM and LPM, respectively), Kupffer cells (KC), red pulp splenic macrophages (RPM), small intestinal (SI) and colon (C) lamina propria macrophages (LPM) and microglia from Tmem119+/+Rosa26LSL-EYFP (blue) and Tmem119Cre/+Rosa26 LSL-EYFP (red) mice. j, Numbers of microglia quantified by flow cytometry in IMDTR and littermate control mice injected i.p. with 50 or 500 ng DT and evaluated 24 or 72 h post-DT injection. Data show mean ± SEM and are pooled from 2 independent experiments (c,e,g,i,j) (c,e,g,i: Tmem119+/+Rosa26LSL-EYFP; Tmem119Cre/+Rosa26 LSL-EYFP: n = 4;6 mice per group, respectively; j: n = 3-4 mice per group). P values were calculated using a two-way (c,e,g,i) or a one-way (j) analysis of variance (ANOVA) with Tukey’s post hoc test. In g, P values compare IMs vs. every other population. Raw data and P values are provided as a source data file. *, P < 0.05; ****, P < 0.0001. ns, not significant.

