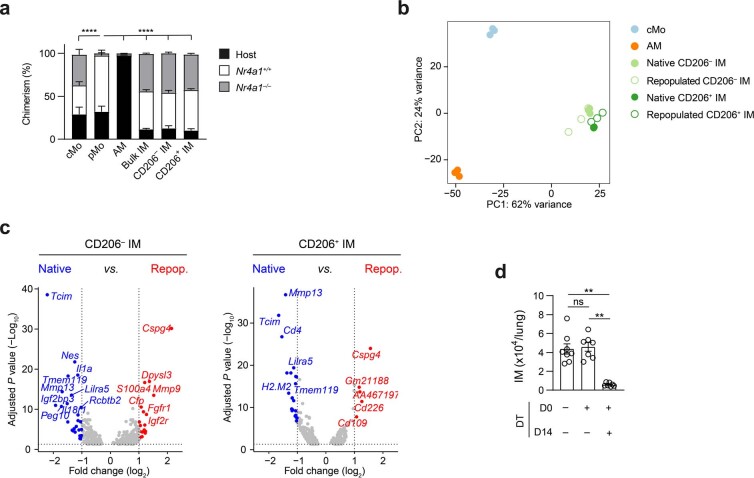
Extended Data Fig. 4. IM niche refilling is independent of Nr4a1 and repopulated IMs are largely similar to native IMs 14 days post-DT in IMDTR mice.
a, Bar graphs showing % of Nr4a1+/+ donor, Nr4a1−/− donor and host chimerism in the indicated cell populations from lethally-irradiated, thorax-protected CD45.1/CD45.2 IMDTR mice transplanted with a 1:1 mix of CD45.2 Nr4a1−/− and CD45.1 Nr4a1+/+ BM cells, injected with 50 ng DT i.p. 4 weeks later and evaluated at day 7 post-DT. b, Principal Component (PC) analysis plot with % indicating the variability explained by each PC component, obtained by bulk RNA-seq analysis of lung cMo, AMs, CD206− IMs and CD206+ IMs from untreated IMDTR mice, and of lung CD206− IMs and CD206+ IMs from DT-treated IMDTR mice at day 14 post-DT (n = 3 pooled mice per replicate, 3 replicates per condition). c, Volcano plots depicting the DEG between native and repopulated CD206− IMs (left) and native and repopulated CD206+ IMs (right). Transcripts significantly upregulated in native and repopulated IM subsets are colored in blue and red, respectively (log2 fold-change ± 1 and adjusted P value < 10−2). d, Bar graph showing lung IM numbers assessed by flow cytometry in IMDTR mice treated or not with DT i.p. at day 0 and 14, and analyzed 24 h after the last DT treatment (day 15). Data show mean ± SEM and are pooled from 2 independent experiments (a,d) (a,d: n = 4,7-8 mice per group, respectively). P values were calculated using a one-way ANOVA with Tukey’s post-hoc tests, and compare donor CD45.1 Nr4a1+/+ chimerism between cell populations in a. Raw data and P values are provided as a source data file. **, P < 0.01; ****, P < 0.0001. ns, not significant.

