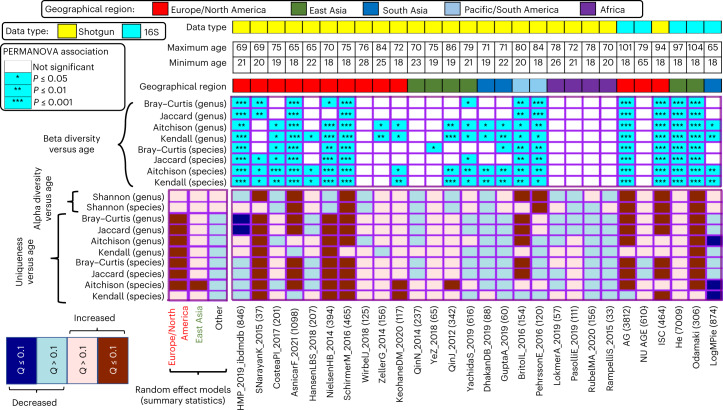
Fig. 1. Association of measures of microbiome uniqueness, Shannon diversity and beta diversity with age in different study cohorts shows region-specific variabilities.
The names of the study cohorts appear as listed in Table 1, and the number of investigated gut microbiomes are indicated in parentheses. The top four rows indicate the data type (Shotgun or 16S; as per legend), maximum and minimum participant age and the geographical region. The heatmap immediately below these panels shows the results of PERMANOVA for associating overall beta diversity with age computed using the four microbiome distance matrices analyzed at the levels of genus and species. The bottom heatmap shows the results of the robust linear regression models for associating species and genus-level microbiome summary statistics with age across the different individual studies. The statistical significance of the associations were computed using two-sided robust F-tests. The P values obtained for the association of the different microbiome summary indices were corrected on a per-study cohort basis using Benjamini–Hochberg correction to compute the Q-values. Also indicated on the right of this heatmap are the results of the association meta-analyses of these microbiome summary statistics with age for studies grouped based on their geographical regions. For a given geographical region, the summarized associations are computed using random effect models on the specific individual study-specific effect sizes (computed based on robust linear regression models (Methods)). As for the previous heatmap, the P values obtained for the association of each summary index were corrected on for each geography-specific study groups using Benjamini–Hochberg corrections. The results show that age-wise association of the gut microbiome with age (association of individual summary statistics as well as overall diversity) shows region-specific signatures, with the strongest effects being observed for the European and North American cohorts. Various measures of uniqueness and diversity strongly associate with age, but only for the European and North American cohorts.

